Excel Option Pricer
Excel based Black and Scholes calculator for European stock/index options and American options using dividend yields.
- Theoretical Price and Option Greeks support
- Implied Volatility Calculator
- Configurable Payoff Graphs
- Option Strategy Construction
- VBA used is unlocked and editable
Grab Your Free Copy
Enter your name and email and I'll send the workbook straight to your inbox.
My option pricing spreadsheet will allow you to price European call and put options using the Black and Scholes model.
Understanding the behavior of option prices in relation to other variables such as underlying price, volatility, time to expiration etc is best done by simulation. When I was first learning about options I began building a spreadsheet to help me understand the payoff profiles of calls and puts and also what the profiles look like of different combinations. I've uploaded my workbook here and you're welcome to it.
Simplified
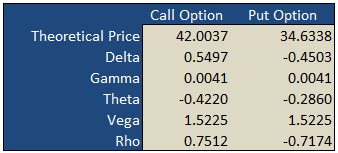
On the "basic" worksheet tab you will find a simple option calculator that generates fair values and option Greeks for a single call and put according to the underlying inputs you select. The white areas are for your user input while the shaded green areas are the model outputs.
Implied Volatility
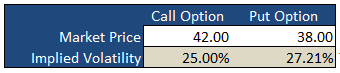
Underneath the main pricing outputs is a section for calculating the implied volatility for the same call and put option. Here, you enter the market prices for the options, either last paid or bid/ask into the white Market Price cell and the spreadsheet will calculate the volatility that the model would have used to generate a theoretical price that is in-line with the market price i.e. the "implied" volatility.
Payoff Graphs
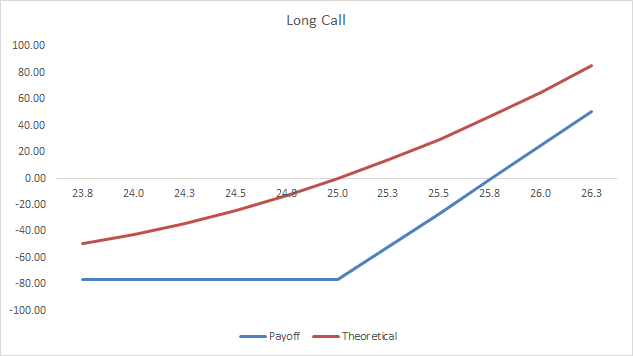
The PayoffGraphs tab gives you the profit and loss profile of basic option legs; buy call, sell call, buy put and sell put. You can change the underlying inputs to see how your changes effect the profit profile of each option.
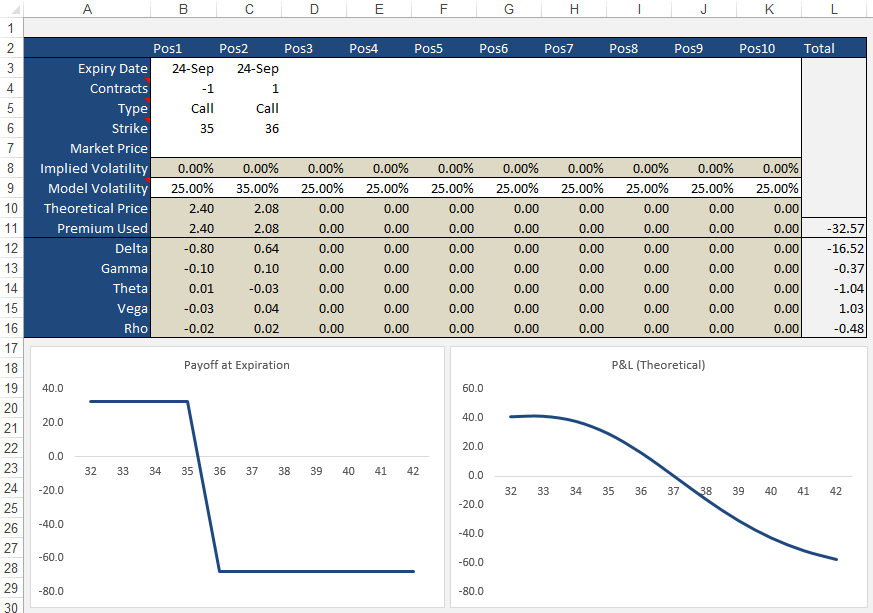
Strategies
The Strategies tab allows you to create option/stock combinations of up to 10 components. Again, use the white areas for your user input while the shaded areas are for the model outputs.
Formulas
Theoretical and Greek Prices
Use this Excel formula for generating theoretical prices for either call or put as well as the option Greeks:
- Type
- c = Call, p = Put, s = Stock
- Output
- p = theoretical price, d = delta, g = gamma, t = theta, v = vega, r = rho
- Underlying Price
- The current market price of the stock
- Exercise Price
- The exercise/strike price of the option
- Time
- Time to expiration in years e.g. 0.50 = 6 months
- Interest Rates
- As a percentage e.g. 5% = 0.05
- Volatility
- As a percentage e.g. 25% = 0.25
- Dividend Yield
- As a percentage e.g. 4% = 0.04
A sample formula would look like =OTW_BlackScholes(c, p, 25, 26, 0.25, 0.05, 0.21, 0.015).
Implied Volatility
Same inputs as above except:
- Market Price
- The current market last, bid/ask of the option
Example: =OTW_IV(p, 100, 100, 0.74, 0.05, 8.2, 0.01)
Support
If you're having troubles getting the formulas to work, please check out the support page or send me an email.
If you're after an online version of an option calculator then you should visit Option-Price.com
Much of what I learnt that made this spreadsheet possible was taken from the highly acclaimed book on financial modeling by Simon Benninga — Financial Modeling - 3rd Edition. If you're an Excel junkie, you'll love it.
118 Comments
Peter December 14th, 2016 at 4:57pm
Hi Clark,
The arrows change the Date Offset value in cell P3. This enables you to view the changes to the theoretical value of the strategy as each day passes.
Clark December 14th, 2016 at 4:12am
What are the up/down arrows supposed to do on strategies page?
Peter October 7th, 2014 at 6:21am
Hi Denis,
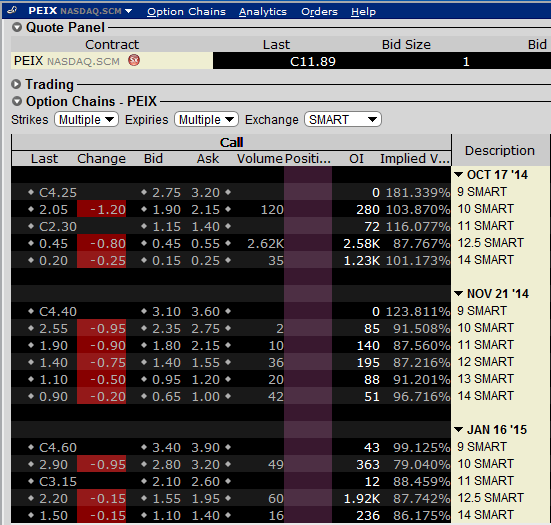
I used 5 just to ensure there was enough buffer to handle high volatilities. 200% IV's aren't that uncommon - even just now, looking at PEIX the $9 October strike is showing 181% on my broker terminal.
But, of course, you're welcome to change the upper value if a lower number improves performance for you. I just used 5 for ample room.
Regarding the historical volatility, I would say the typical use is close to close. Take a look at my Historical Volatility Calculator for an example.
Denis October 7th, 2014 at 3:07am
Hi Peter,
Just a simple question, I am wondering why ImpliedCallVolatility & ImpliedPutVolatility has a "high = 5" the highest volatility I see is about 60%
Therefore wouldn't setting "high = 2" make more sense. I know it doesn't make much difference to speed, but I tend to be pretty precise when it comes to programming.
On another note, I am having a hard time figuring out what Historical Volatility of the underlying assets. I know some people use close-to-close, average of high&low, also different moving averages like 10-day, 20-day, 50-day.
Peter June 10th, 2014 at 1:09am
Hi Jack,
Thanks for posting!
I appreciate you posting the numbers in the comment, however, it's hard for me to make sense of what is going on. Is it possible for you to email me your Excel sheet (or modified version of) to "admin" at this domain? I'll take a look and let you know what I think.
Jack Ford June 9th, 2014 at 5:32am
Sir,
In the Option Trading Workbook.xls OptionPage.
I changed the underling price and strike price to calculate the IV,
as below.
7,000.00 Underlying Price
24-Nov-11 Today's Date
30.00% Historical Volatility
19-Dec-11 Expiry Date
3.50% Risk Free Rate
2.00% Dividend Yield
25 DTE
0.07 DTE in Years
Theoretical Market Implied
Strike Prices Price Price Volatility
6,100.00 ITM 912.98 999.00 57.3540%
6,100.00 ITM 912.98 912.98 30.0026%
6,100.00 ITM 912.98 910.00 27.6299%
6,100.00 ITM 912.98 909.00 26.6380%
6,100.00 ITM 912.98 0.0038%
6,100.00 ITM 912.98 907.00 24.0288%
6,100.00 ITM 912.98 906.00 21.9460%
6,100.00 ITM 912.98 905.00 0.0038%
6,100.00 ITM 912.98 904.00 0.0038%
6,100.00 ITM 912.98 903.00 0.0038%
6,100.00 ITM 912.98 902.00 0.0038%
My question is : When the market price was changed from 906 to 905, why
the IV was changed so dramatically?
I like your web and excel workbook very much, they are the best in the
market!
Thank you very much!
Peter January 10th, 2014 at 1:14am
Hi CDT,
Yes, the fucntions I created using a macro/module.
There is a formula only version on this page;
Black Scholes
Let me know if this works.
cdt January 9th, 2014 at 10:19pm
I tried the spreadsheet in Openoffice, but it did not work. Does that use Macros or imbedded functions?
I was looking for something without macros, since my openoffice does not usually work with Excel macros.
Thanks for any possible help.
Ravi June 3rd, 2013 at 6:40am
Can you please let me know how we can calculate Risk Free Rate in case of USDINR Currency Pair or any other pair in general.
Thanks in Advance.
Peter May 28th, 2013 at 7:54pm
Hi Max,
Mmm, not really. You can change the volatility back and forth but the current implementation doesn't plot greeks vs volatility.
You can check out the online version;
Option-Price.com
It has a simulation table at the end of the page that plots greeks vs both price and volatility.
Add a Comment