Excel Option Pricer
Excel based Black and Scholes calculator for European stock/index options and American options using dividend yields.
- Theoretical Price and Option Greeks support
- Implied Volatility Calculator
- Configurable Payoff Graphs
- Option Strategy Construction
- VBA used is unlocked and editable
Grab Your Free Copy
Enter your name and email and I'll send the workbook straight to your inbox.
My option pricing spreadsheet will allow you to price European call and put options using the Black and Scholes model.
Understanding the behavior of option prices in relation to other variables such as underlying price, volatility, time to expiration etc is best done by simulation. When I was first learning about options I began building a spreadsheet to help me understand the payoff profiles of calls and puts and also what the profiles look like of different combinations. I've uploaded my workbook here and you're welcome to it.
Simplified
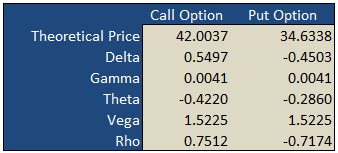
On the "basic" worksheet tab you will find a simple option calculator that generates fair values and option Greeks for a single call and put according to the underlying inputs you select. The white areas are for your user input while the shaded green areas are the model outputs.
Implied Volatility
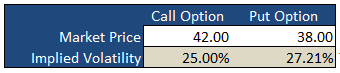
Underneath the main pricing outputs is a section for calculating the implied volatility for the same call and put option. Here, you enter the market prices for the options, either last paid or bid/ask into the white Market Price cell and the spreadsheet will calculate the volatility that the model would have used to generate a theoretical price that is in-line with the market price i.e. the "implied" volatility.
Payoff Graphs
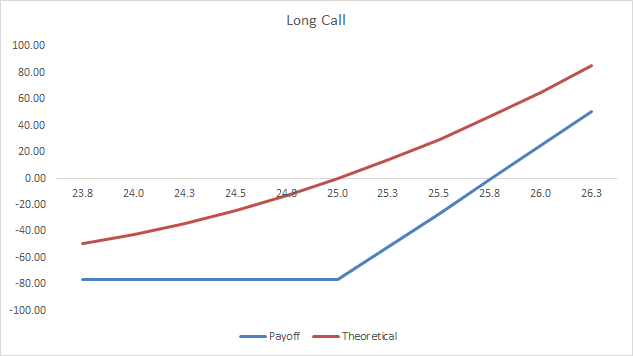
The PayoffGraphs tab gives you the profit and loss profile of basic option legs; buy call, sell call, buy put and sell put. You can change the underlying inputs to see how your changes effect the profit profile of each option.
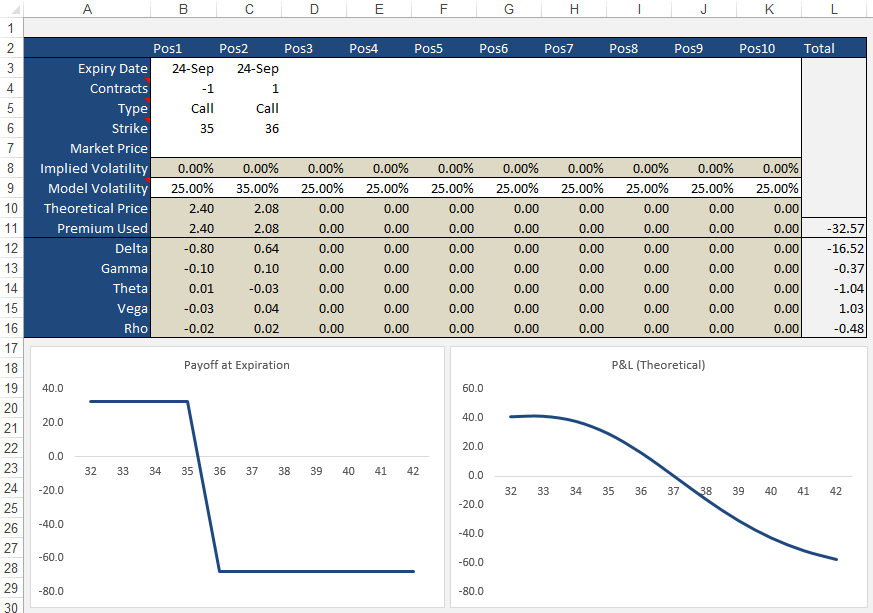
Strategies
The Strategies tab allows you to create option/stock combinations of up to 10 components. Again, use the white areas for your user input while the shaded areas are for the model outputs.
Formulas
Theoretical and Greek Prices
Use this Excel formula for generating theoretical prices for either call or put as well as the option Greeks:
- Type
- c = Call, p = Put, s = Stock
- Output
- p = theoretical price, d = delta, g = gamma, t = theta, v = vega, r = rho
- Underlying Price
- The current market price of the stock
- Exercise Price
- The exercise/strike price of the option
- Time
- Time to expiration in years e.g. 0.50 = 6 months
- Interest Rates
- As a percentage e.g. 5% = 0.05
- Volatility
- As a percentage e.g. 25% = 0.25
- Dividend Yield
- As a percentage e.g. 4% = 0.04
A sample formula would look like =OTW_BlackScholes(c, p, 25, 26, 0.25, 0.05, 0.21, 0.015).
Implied Volatility
Same inputs as above except:
- Market Price
- The current market last, bid/ask of the option
Example: =OTW_IV(p, 100, 100, 0.74, 0.05, 8.2, 0.01)
Support
If you're having troubles getting the formulas to work, please check out the support page or send me an email.
If you're after an online version of an option calculator then you should visit Option-Price.com
Much of what I learnt that made this spreadsheet possible was taken from the highly acclaimed book on financial modeling by Simon Benninga — Financial Modeling - 3rd Edition. If you're an Excel junkie, you'll love it.
118 Comments
Kyle October 5th, 2011 at 3:24am
Yes, was receiving a $MARCOS? and $NAME? error. I have enabled the marcos, but still getting the $NAME? error. Thanks for your time.
Peter October 4th, 2011 at 5:04pm
Yes, it should work. Are you having troubles with Open Office?
Kyle October 4th, 2011 at 1:39pm
I was wondering if this spreadsheet can be opened with open office? If so how would i go about this?
Peter October 3rd, 2011 at 11:11pm
Hi NK,
Whatever money costs you (i.e. to borrow) is your interest rate.
If you want to calculate the historical volatility for a stock then you can use my historical volatility spreadsheet.
You will also need to consider dividend payments if this is a stock that pays dividends and enter the effective yearly yield in the "dividend yield" field.
The prices don't have to match. If the prices are out, this just means that the market is "implying" a different volatility for the options than what you have estimated in your historical volatility calculation. This could be in anticipation of a company announcement, economic factors etc.
NK October 1st, 2011 at 11:59am
Hi, i'm new to options. I'm calculating the Call and Put premiums for TATASTEEL(I used American Style options calculator). Date - 30 Sept, 2011.
Price - 415.25.
Strike price - 400
Interest rate - 9.00%
Volatility - 37.28%(I got this from Khelostocks.com)
Expiration Date - 25 Oct
CALL - 25.863 PUT - 8.335
Are these values correct or do i need to change any input parameters.
Also plz tell me what to put for Interest rate and from where to get the volatility for particular stocks in calculation.
The current price for the same options are
CALL - 27 PUT - 17.40.
Why is there such a difference and what should be my trading strategy in these?
Peter September 8th, 2011 at 1:49am
Yes, it is for European options so it will suit the Indian NIFTY index options but not the stock options.
For retail traders I would say that a B&S is close enough for American options anyway - used as a guide. If you're a market maker, however, you would want something more accurate.
If you're interested in pricing American options you can read the page on the binomial model, which you'll also find some spreadsheets there.
Mehul Nakar September 8th, 2011 at 1:23am
is this File Made in European style or American style option
How to USE in INDIA market
as Indian OPTIONS are trading in American style
can u make it American style model for Indian market user???
thanks in advance
Mahajan September 3rd, 2011 at 12:34pm
Hi Peter,
Sorry for the confusion, but i am looking for some volatility formula only for futures trading (and not options).Can we use historical volatility in futures trading ? Any source/link you have, will be a great help to me.
Regards,
Mahajan
Peter September 3rd, 2011 at 6:05am
Hi Gina,
15 points is the profit of the spread, yes, but you have to subtract the price that you have paid for the spread, which I assume is 5 - making your total profit 10 instead of 15.
Peter September 3rd, 2011 at 6:03am
Hi Mahajan,
Do you mean options on futures or just straight futures?
The spreadsheet can be used for options on futures but is not useful at all if you are just trading outright futures.
Add a Comment