Definition of Option Gamma
The Gamma of an option measures the rate of change of the option delta. Its' number is denoted relative to a one point move in the underlying asset. For example, if the gamma for an option shows 0.015 with a delta of 0.45 then a full point move in the stock (i.e. 35 to 36) means the delta will move to 0.465.
Gamma is calculated via an option model such as Black and Scholes or Binomial. The value is the same for both call and put options.
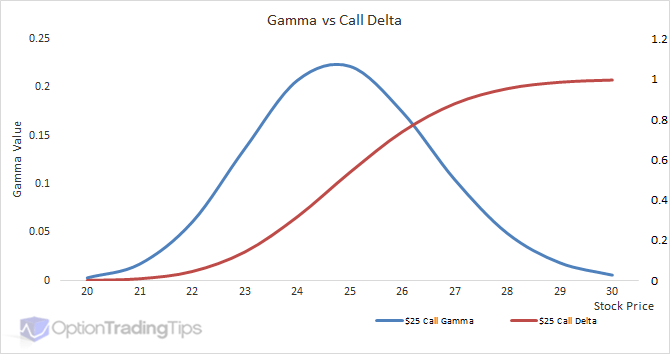
The Gamma of an option is important to know because the delta of an option is not constant; the delta increases and decreases as the underlying moves. Because delta is essentially our position value in the underlying, the gamma therefore tells traders how fast their position will increase or decrease in value vs movements in the underlying asset.
In other words, Gamma shows how volatile an option is relative to movements in the underlying asset. So, watching your gamma will let you know how large your delta (position risk) changes.
When is Option Gamma Highest?
Gamma is not linear. Like Delta, Gamma has curvature and is effected by the inputs that calculate the Gamma, the most notable forces that influence it are factors such as the difference between the strike price and the underlying price, the time to expiration of the option and the implied volatility used in the model. Interest rates and dividends are also factors that effect the value of the Gamma, however, the magnitude of these inputs is minimal when compared to the previously mentioned variables.
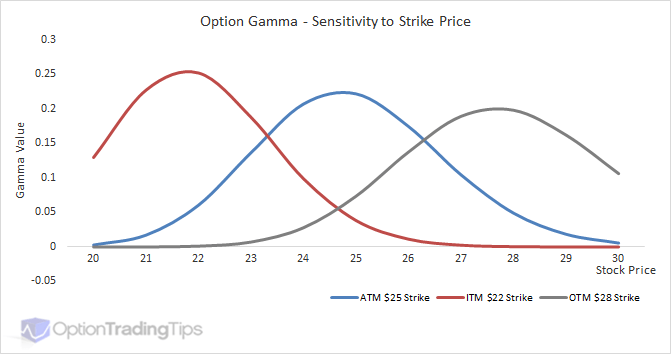
The attention on a Gamma's sensitivity is mostly focused on its' position relative to the underlying price. Looking at the above graph you can see that the Gamma reaches its' peak when the option is at-the-money and tapers off either side. When an option position moves towards the ATM level, the changes in the position delta, and hence the position value relative to the stock, change with greater amounts. Options that are either deep ITM or deep OTM experience less variability as the stock price changes and therefore will show low Gamma values.
Time and Volatility
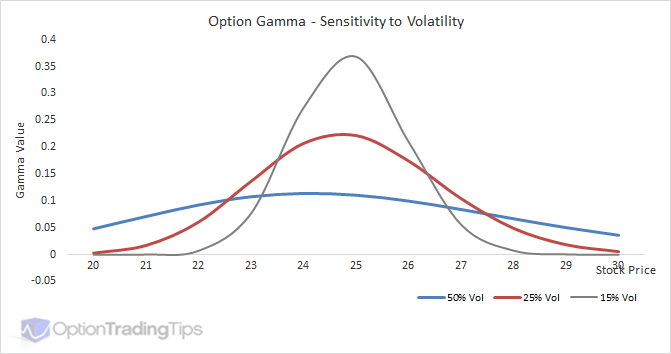
Adding more time to an option contract increases the likelihood of that option expiring in-the-money. Because higher volatility also increases the chances of an option's in-the-moneyness, both volatility and time have the same effect on an option's Gamma value.
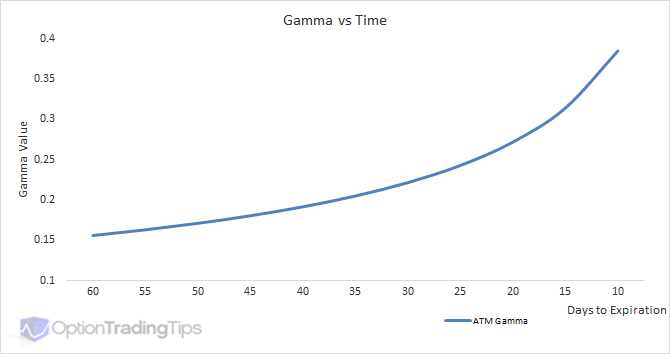
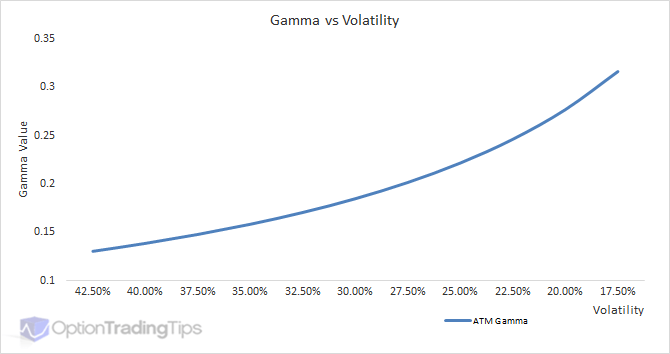
The above graphs show how increasing time/volatility value reduces the Gamma of the option and hence it's sensitivity to changes in stock price.
While adding more time to an option increases the VAUE of the option, it generally reduces the option's Gamma. With more time to expiration the option becomes less sensitive to movements in the underlying asset. However, as the option approaches its' maturity date, its' time value will move towards zero and then become more responsive to changes in the underlying price.
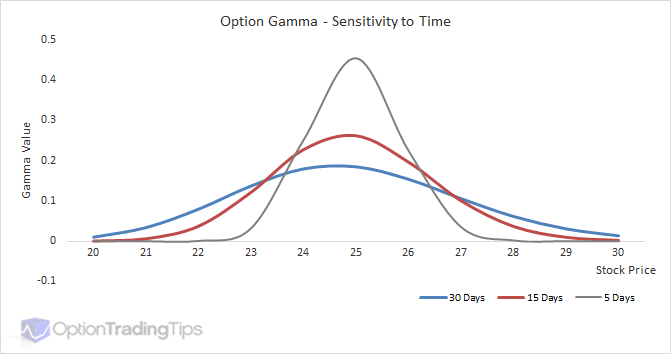
These graphs provide a great way to look at how Gamma is effected by the passage of time. Both plot a $25 call option's Gamma across a range of underlying prices, however, on each graph is shown 3 different times to maturity. This is so you can see how the Gamma value becomes the highest when it is both ATM and close to expiration. When this happens, option positions will have the highest fluctuations in position value (Delta).
What is Long Gamma?
Note: The Gamma value is the same for calls as for puts. If you are long a call or a put, the gamma will be a positive number. If you are short a call or a put, the gamma will be a negative number.
When you are "long gamma", your position will become "longer" as the price of the underlying asset increases and "shorter" as the underlying price decreases.
Conversely, if you sell options, and are therefore "short gamma", your position will become shorter as the underlying price increases and longer as the underlying decreases.
This is an important distinction to make between being long or short options - both calls and puts. That is, when you are long an option (long gamma) you want the market to move. As the underlying price increases, you become longer, which reinforces your newly long position.
If being "long gamma" means you want movements in the underlying asset, then being "short gamma" means that you do not want the price of the underlying asset to move.
A short gamma position will become shorter as the price of the underlying asset increases. As the market rallies, you are effectively selling more and more of the underlying asset as the delta becomes more negative.
Gamma in Option Chain
The graphs shown here, display gamma with constant volatility and strike price. In practice, options across different strike prices have different implied volatilities and therefore a different gamma distribution.
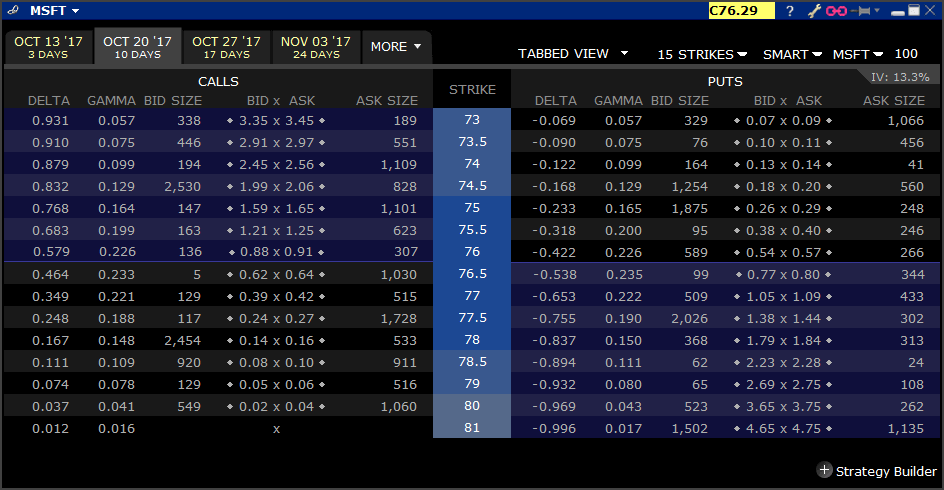
The above is an example of what Gamma and Delta values look in practice. This is an option chain of MSFT stock options showing an expiration 10 days out.
Notice how the ATM strike of $76.50 shows the highest Gamma value of 0.233 for the calls and 0.235 for the puts. I'm not sure why they are different here...they really should show exactly the same value for the call and the put - perhaps a rounding issue. Nevertheless, 0.002 difference is fairly immaterial.
If the stock trades up 1 full point to $77.29 then the $76.50 call option Delta will move from 0.464 to 0.697. So while the stock price has only moved 1.3% your effective position in the underlying has increased by 50%.
Black Scholes Gamma
If you're interested in knowing how to calculate option gamma in excel, you can download my option pricing spreadsheet for a working example. Otherwise, here are some code examples:
Excel VBA
Option Gamma Formula
NdOne(UnderlyingPrice, ExercisePrice, Time, Interest, Volatility, Dividend) / (UnderlyingPrice * (Volatility * Sqr(Time)))Where:
NdOne = Exp(-(dOne(UnderlyingPrice, ExercisePrice, Time, Interest, Volatility, Dividend) ^ 2) / 2) / (Sqr(2 * 3.14159265358979)) dOne = (Log(UnderlyingPrice / ExercisePrice) + (Interest - Dividend + 0.5 * Volatility ^ 2) * Time) / (Volatility * (Sqr(Time)))
29 Comments
Peter March 26th, 2012 at 8:58pm
Hi Charlie,
If the contract size is 10mt then your position delta, which is the amount that you need to hedge is 213 contracts (shares).
The value change to your position according to the delta isn't with "every" 1 point move - just with the first. Because, as you've indicated the delta itself will change as the underlying changes, which is given by the gamma.
So after the underlying has moved 1 point you will have a new delta and gamma value.
Also, gamma is basis a 1 point move unless it is specified as 1% gamma.
Charlie March 23rd, 2012 at 12:54am
Hello Peter, i have new software for options portfolio/prcing, and with a postion i have on the delta is -0.2138 (short a call) and the gamma -0.0158. If I am 100 lots short of the call (contract size = 10mt) then to be delta hedged i would need to buy 21 lots. As i understand correctly, the delta also means that the value of my position would decrease by $213 with every tick upwards. However in this instance the gamma of -0.0158 would mean that my delta goes shorter by -1.58 lots every % point higher NOT every tick higher (otherwsie gamma would be too big). The gamma value of the trade says -$15.8 which i think means the delta will decrease by this value for every % move upwards? Can you help. You agree confusing that delta is basis one tick move and gamma basis 1% move?
Nave February 10th, 2012 at 12:53am
Great work Peter
Peter November 5th, 2011 at 4:06am
Hi Rick,
Yes, that's correct. Both calls and puts have the same gamma value, which will decrease either side of ATM.
Rick November 4th, 2011 at 8:45am
Hi I want your feedback
If a call, initially otm, and then the stock price approaching the exercise price, the gamma would increase, when the call is in the money, gamma would decrease?
If a put, initially OTM, then if a stock price decreases, gamma would increase, and when the put is in the money, gamma would decrease if the stock still going down?
Am I saying the right things
THX
Peter June 5th, 2011 at 5:55am
Hi Peter87, it might help to take a look at the delta graphs on the option delta page. Take a look at the Put Delta vs Underlying Price graph.
This represents a long put - so just reverse the numbers for a short put.
I.e. for a long put if the underlying price increase from 50 to 60 the delta will go from -0.40 to -0.20 (longer).
For a short put the delta is reversed. So as the underlying price goes from 50 to 60 the short put delta will go from +0.40 to +0.20 (shorter).
Peter87 June 4th, 2011 at 8:06am
Thanks for your detailed and fast answer!
I got the part concerning calls and long puts but not the part with short puts: A short put has a concave (and negative) pay off profile. So, the higher the underlying value gets, the more approaches the pay off line the x-axis which implies that the slope (<=> delta) becomes bigger (= less negative = approaches 0).
That's why I don't get it that the position in a short put becomes shorter when the underlying price increases. In my opinion the position becomes LESS shorter (it becomes longer). But I guess there must be some reasoning errors in my argumentation!? :-)
Peter June 4th, 2011 at 6:36am
The Delta depends on the option; call options have a position Delta and put options have a negative Delta. So, if you "sell" an option the call with have a negative Delta and the put a positive Delta.
Now, given that Gamma is positive for both calls and puts, if you sell an option your Gamma with therefore be negative.
When you're short an option and hence short Gamma both a short call and short put will "lose" Delta as the underlying price rises - this is also refered to as being "shorter".
For a call option, as the underlying price rises the option itself becomes more in-the-money and hence the Delta will move from 0 to 1. But if you are "short" the call the opposite happens meaning that the option Delta of your position will move from 0 to -1 (getting shorter).
For a put option, as the underlying price rises the option itself becomse more out-of-the-money and hence the Delta will move from -1 to 0 (getting longer). But if you are "short" the put the opposite happens meaing that the option Delta of your position will move from 1 to 0 (getting shorter).
Let me know if this is not clear.
Peter87 June 3rd, 2011 at 2:47pm
I'm a beginner in options but understand almost the whole article. What I just don't understand is this:
"Conversely, if you sell options, and are therefore "short gamma", your position will become shorter as the underlying price increases [...]"
Delta (as first derivative) is negative and grows with increasing Underlying price, so it becomes LESS negative which means "less short" <=> "more long" !?!?!?!?
I would appreciate your feedback!
Peter November 3rd, 2010 at 4:54am
Are you talking about the video on this site above? That's where I say "take a look at this video". Then I provide a link to the OU site. The video above on "this" site does indeed do more than "describe" what gamma is and elaborates on gamma trading.
Please let me know if I have missed something or if you think the video above is incorrect.
Add a Comment