Definition of Option Vega
The Vega of an option indicates how much, theoretically at least, the price of the option will change as the volatility of the underlying asset changes.
Vega is quoted to show the theoretical price change of the option for every 1 percentage point change in volatility. For example, if the theoretical price is 2.5 and the Vega is showing 0.25, then if the volatility moves from 20% to 21% the theoretical price will increase to 2.75.
Like Gamma, Vega is the same for both call and put options.
Vega Graphs - When is Vega Highest?
Like all other option Greeks, Vega isn't linear; it changes constantly as all other inputs to the pricing of options change. Some factors have a greater impact on the pricing of options than others. Below you'll find illustrations of the various affects these factors can have on the Vega values of options.
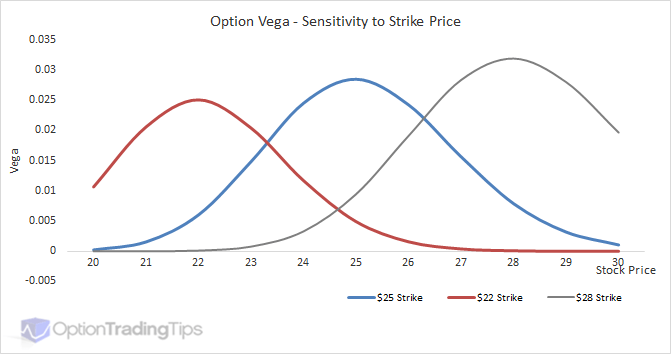
Vs Strike
ATM options are most sensitive to changes in volatility and therefore have the highest Vega values. Vega then tapers off towards OTM and ITM option strikes.
Vs Time
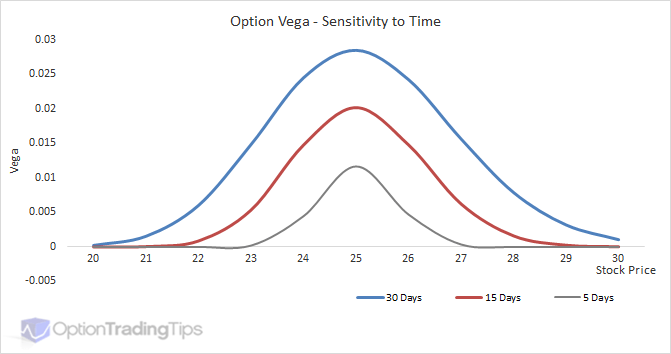
Volatility and time are basically the same thing when it comes to option valuation. Adding more volatility to an option is the equivalent of adding more time; that is, it increases the value of the option. The reason is that increasing either of these elements increases the likelihood of the option being in-the-money by the expiration date.
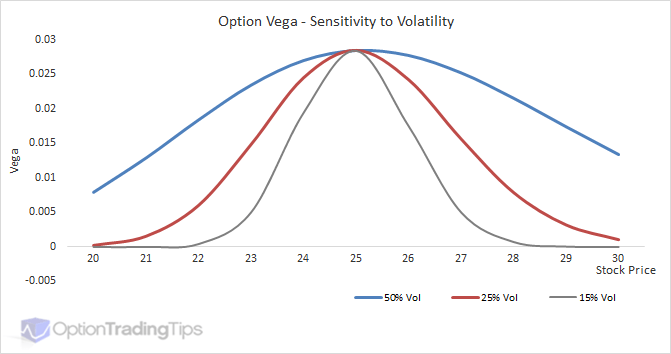
Vs Volatility
Long and Short Vega Positions
Vega has the same value for calls and puts and its' value is a positive number. That means when you buy an option, whether call or put, you have a positive Vega. This is also called being long Vega.
As Vega is effected by volatility, a long Vega position means you want the volatility to rise. When volatility rises, it will increase the value of the option by the Vega amount for every 1 % point move in the volatility. As you are long the option, the increase in the value means an increase in profit.
Conversely, short Vega positions expect volatility to fall in order to profit from a decline in option premiums.
Vega Option Chain
While theoretically the Vega is highest for ATM strikes, in practice this doesn't always happen. In the above Vega vs Strike graph, all other factors in the pricing of the option remain constant, except the strike price. I.e. The volatility input used for the pricing model is the same regardless of whether the option is ITM, ATM or OTM.
In reality, however, the implied volatility as determined by the market prices of the options are not constant; they vary across the strike range and form what's known as the Volatility Skew.
Because the volatility input is different, this can sometimes mean that the strike with the highest Vega isn't always smack on the ATM strike price. Take a look at this option chain of Amazon stock (AMZN).
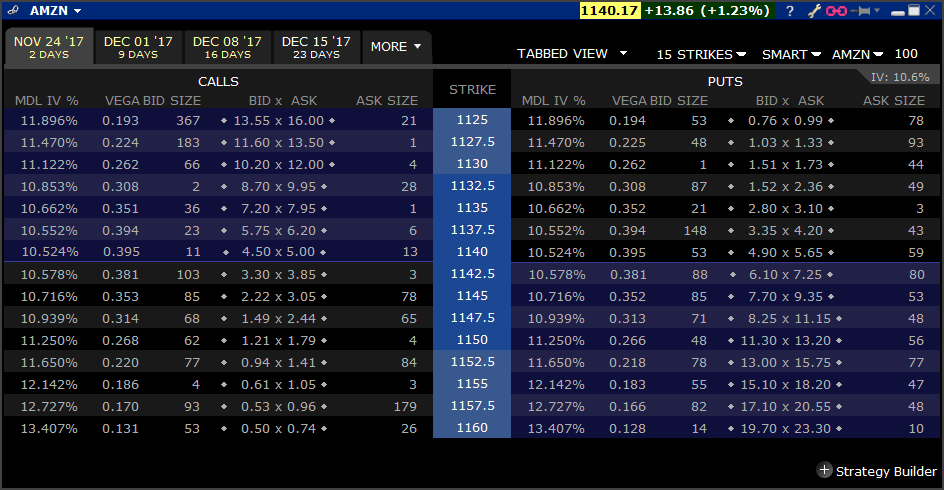
I chose AMZN as it is a high priced stock, which will mean higher Vega values to observe.
These options are only 10 days out, so the forward price for this expiration will be pretty close to the stock price, which is currently 1,140.17. At this stock price the ATM strike on screen will be 1140. The Vega for this strike is 0.395. In this case, the ATM strike does indeed have the highest Vega as the strikes either side taper off and decrease as you move away from the ATM price.
However, notice the implied volatilities shown in the "MDL IV%" column? The vols show the opposite curvature to the Vega; the ATM price is the lowest while the either side of the ATM strike the implied vols increase. The changes to the volatility with this expiration aren't large enough to change the Vega values in this case, but if you do notice higher Vega values outside of the ATM strike, this is likely why.
Black Scholes Vega
Check out my spreadsheet for a working example of Vega using Black and Scholes. Otherwise, here are some code examples:
Excel VBA
Option Vega Formula
Vega = 0.01 * UnderlyingPrice * Sqr(Time) * NdOne(UnderlyingPrice, ExercisePrice, Time, Interest, Volatility, Dividend)Where:
NdOne = Exp(-(dOne(UnderlyingPrice, ExercisePrice, Time, Interest, Volatility, Dividend) ^ 2) / 2) / (Sqr(2 * 3.14159265358979)) dOne = (Log(UnderlyingPrice / ExercisePrice) + (Interest - Dividend + 0.5 * Volatility ^ 2) * Time) / (Volatility * (Sqr(Time)))
38 Comments
James Zhang September 28th, 2017 at 8:56pm
Hi guys,
I have come across an estimation question regarding estimating the 1 day 99% VaR for various positions.
Say I'm shorting $1000 of one month vega, what would be my 99% VaR? what is a reasonable way to estimate?
Question 2:
And also if I'm shorting $1000 cash delta, in order to estimate 1 day VaR 99%, is it right to do this way?
Assume daily volatility of 1%, and assume normal return.
Then the VaR = 1% * Z(99%)*1000 = 1%*2.33*1000 = 23.3?
Question 3:
Is there a difference for estimating VaR between shorting and longing the same cash delta?
Many thanks.
Peter August 16th, 2017 at 12:13am
Hi Robert,
Yes, your table below is correct regarding the direction of the greeks based on the position you have.
Robert August 14th, 2017 at 9:21am
Hello, I have been delta neutral hedging (static) my underlying stocks. I made up this chart to help make decisions to balance out my positions; is it correct? I understand underlying stocks are Delta + but do not have Gamma/Vega....is this also correct? Thank you........
DELTA + DELTA -
LONG CALL SHORT CALL
SHORT PUT LONG PUT
LONG UNDERLYING SHORT UNDERLYING
GAMMA/VEGA + GAMMA/VEGA -
LONG CALL SHORT CALL
LONG PUT SHORT PUT
THETA + THETA -
SHORT CALL LONG CALL
SHORT PUT LONG PUT
Peter May 30th, 2014 at 12:56am
Hi Josh, apoligies for the delay - this one slipped through the cracks.
To buy Vega or go long Vega means to be betting that volatility will increase irrespective of the direction of the asset.
josh zhang May 12th, 2014 at 1:28am
hi all, sometimes forex strategists would recommend buy vega, or long vega, do you know what does that mean? many thanks, josh
Peter September 30th, 2013 at 7:08pm
Ah yes, I had it back to front. October will lose from a rise in IV while December will benefit.
I understand what you're saying but the problem is that each position Vega won't move at the same rate. Because you're "total" Vega is made up of two individual Vega positions you need to take that into account because it is a spread. In your case, even though your total Vega was positive the front month had a large increase in IV that caused your position to lose money.
The problem is that Vega doesn't move in a linear fashion. The changes in Vega that result from a move in the underlying take the shape of a bell curve and not always easy to predict when you're combining option legs from different months.
Perhaps your TOS screen has a different risk value that you could use. Maybe a "Time Weighted Vega" column exists that you could use?
Harsono September 29th, 2013 at 9:57am
Dear Peter,
from your answer :" What you have is a spread where one leg benefits (OCtober) from a rise in IV where the other leg (December) loses from the rise in IV."
I think this is opposit of my posisition, my position is sell october ( Negative Vega )and buy December ( Positif Vega ).
I think if IV increase, I loss my short term Vega ( October ) and gain in my long term Vega ( December ). But my net Vega is positif ( it mean my long term Vega is bigger than my short term Vega ), so if IV increase, in this posisition, I will have some gain, but in my real account , it become loss, so I said before that the Vega works opposit from theory.
This loses, is not combine with gain from increase at underlying and gain from time decey yet, if I combine togather, it means the loss form Vega is huge percentage.
So until now, I still confused, how come Vega works seems reverse from theory.
Thank you.
Peter September 29th, 2013 at 5:49am
Hi Harsono,
The IV is the same, yes, but your position (long/short) will determine the result when the IV moves.
If you are long volatility (long Vega) and the IV rises this will have a positive effect on your position. However, if you are short Vega and IV rises this will be negative for your position.
What you have is a spread where one leg benefits (OCtober) from a rise in IV where the other leg (December) loses from the rise in IV.
Harsono September 27th, 2013 at 11:47am
Hi Peter,
Thank you for your fast reply.
About the IV, I mean the IV is same for long or short contrack is like this :
said IV for GOOG at 20 September was 23.82%, The IV yesterday was 25.24. So this IV is cannot change , even we have long or short contrack.
Here , I copy the answer of my similar question, but honesly I still confuse about the thier answer :( from other web )
"with a calendar you are either buying or selling vega; when you buy a calendar, you are selling front month and buying back month, so you are selling vega, you expect vega to go down; you are selling vega to capture the higher premium, then buying vega back after it drops; here IV has increased so it has gone against you (so far) "
Peter, how do you think about this asnwer ? I think not right , is't it ?
Thank you.
Peter September 26th, 2013 at 7:38pm
Hi Harsono,
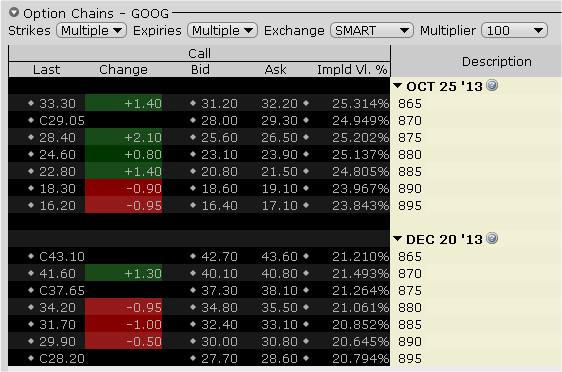
The IV won't be the same for all contracts and especially not for all maturities. Does your TOS show constant IV's across all option contracts? If so, this is not correct. This is a screen grab of Oct/Dec GOOG call options taken from my Interactive Broker's platform;
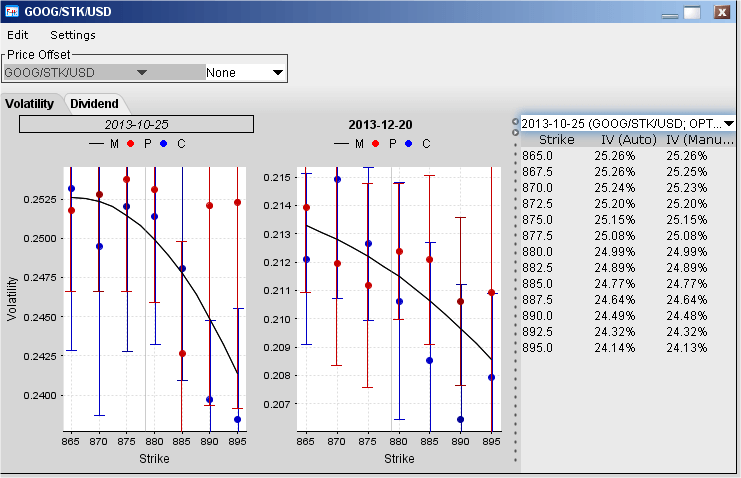
And here is a graph of the volatilities across strikes for both months;
Perhaps TOS just averages out the IV for all strikes and reports that number in your risk?
For your second question - it depends on your view of volatility. If you believe that the volatility is low and expect it to rise, then yes, buying options (long Vega) is a reasonable play. Even better is if the volatility is low before earnings rather than after.
Add a Comment