Definition of Option Vega
The Vega of an option indicates how much, theoretically at least, the price of the option will change as the volatility of the underlying asset changes.
Vega is quoted to show the theoretical price change of the option for every 1 percentage point change in volatility. For example, if the theoretical price is 2.5 and the Vega is showing 0.25, then if the volatility moves from 20% to 21% the theoretical price will increase to 2.75.
Like Gamma, Vega is the same for both call and put options.
Vega Graphs - When is Vega Highest?
Like all other option Greeks, Vega isn't linear; it changes constantly as all other inputs to the pricing of options change. Some factors have a greater impact on the pricing of options than others. Below you'll find illustrations of the various affects these factors can have on the Vega values of options.
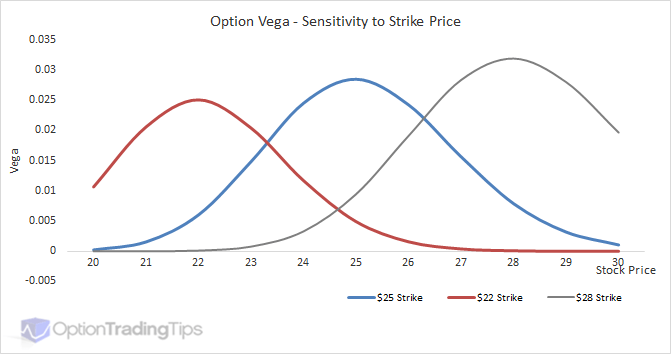
Vs Strike
ATM options are most sensitive to changes in volatility and therefore have the highest Vega values. Vega then tapers off towards OTM and ITM option strikes.
Vs Time
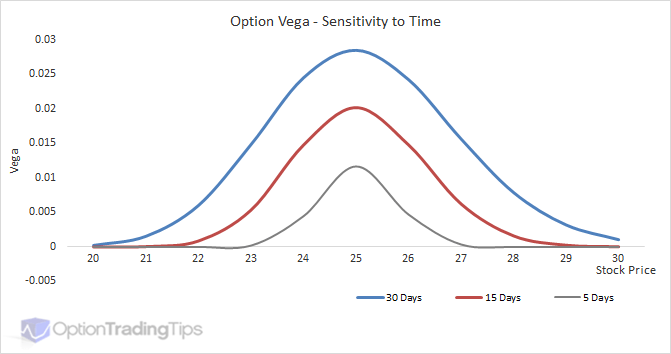
Volatility and time are basically the same thing when it comes to option valuation. Adding more volatility to an option is the equivalent of adding more time; that is, it increases the value of the option. The reason is that increasing either of these elements increases the likelihood of the option being in-the-money by the expiration date.
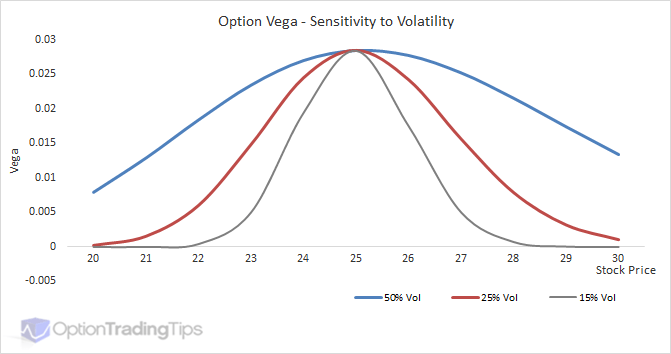
Vs Volatility
Long and Short Vega Positions
Vega has the same value for calls and puts and its' value is a positive number. That means when you buy an option, whether call or put, you have a positive Vega. This is also called being long Vega.
As Vega is effected by volatility, a long Vega position means you want the volatility to rise. When volatility rises, it will increase the value of the option by the Vega amount for every 1 % point move in the volatility. As you are long the option, the increase in the value means an increase in profit.
Conversely, short Vega positions expect volatility to fall in order to profit from a decline in option premiums.
Vega Option Chain
While theoretically the Vega is highest for ATM strikes, in practice this doesn't always happen. In the above Vega vs Strike graph, all other factors in the pricing of the option remain constant, except the strike price. I.e. The volatility input used for the pricing model is the same regardless of whether the option is ITM, ATM or OTM.
In reality, however, the implied volatility as determined by the market prices of the options are not constant; they vary across the strike range and form what's known as the Volatility Skew.
Because the volatility input is different, this can sometimes mean that the strike with the highest Vega isn't always smack on the ATM strike price. Take a look at this option chain of Amazon stock (AMZN).
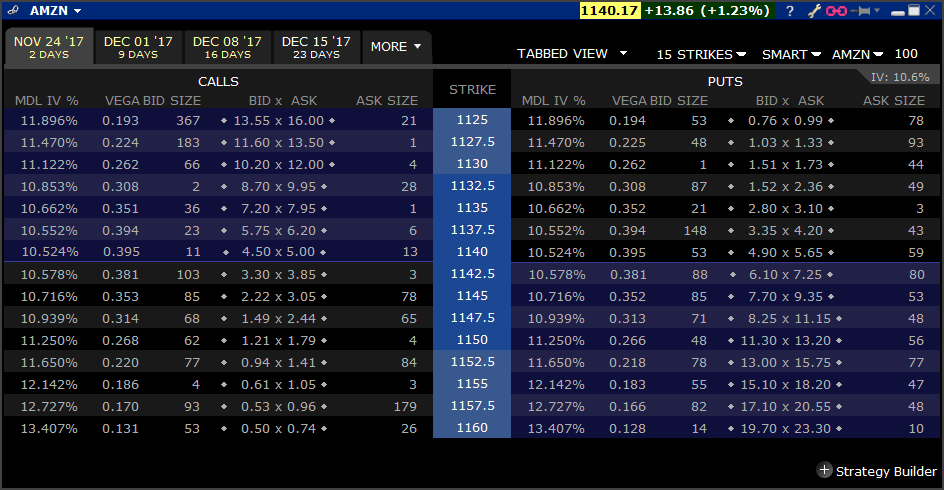
I chose AMZN as it is a high priced stock, which will mean higher Vega values to observe.
These options are only 10 days out, so the forward price for this expiration will be pretty close to the stock price, which is currently 1,140.17. At this stock price the ATM strike on screen will be 1140. The Vega for this strike is 0.395. In this case, the ATM strike does indeed have the highest Vega as the strikes either side taper off and decrease as you move away from the ATM price.
However, notice the implied volatilities shown in the "MDL IV%" column? The vols show the opposite curvature to the Vega; the ATM price is the lowest while the either side of the ATM strike the implied vols increase. The changes to the volatility with this expiration aren't large enough to change the Vega values in this case, but if you do notice higher Vega values outside of the ATM strike, this is likely why.
Black Scholes Vega
Check out my spreadsheet for a working example of Vega using Black and Scholes. Otherwise, here are some code examples:
Excel VBA
Option Vega Formula
Vega = 0.01 * UnderlyingPrice * Sqr(Time) * NdOne(UnderlyingPrice, ExercisePrice, Time, Interest, Volatility, Dividend)Where:
NdOne = Exp(-(dOne(UnderlyingPrice, ExercisePrice, Time, Interest, Volatility, Dividend) ^ 2) / 2) / (Sqr(2 * 3.14159265358979)) dOne = (Log(UnderlyingPrice / ExercisePrice) + (Interest - Dividend + 0.5 * Volatility ^ 2) * Time) / (Volatility * (Sqr(Time)))
38 Comments
Peter March 5th, 2011 at 9:59pm
Do you mean forecasting volatility? I've never come across any methods that use Vega to forecast volatility before. I've heard of methods such as GARCH that attempt this but I don't have any experience with these strategies so I can't comment directly.
Throb March 5th, 2011 at 5:15pm
Can vega be used to "theorized" expected forward IV spots?
Peter January 17th, 2011 at 5:25am
Hi Pankaj, Vega is always positive for calls and puts for both European and American options. This is because an increase in volatility always increases the theoretical value of an option - call or put.
Pankaj January 16th, 2011 at 7:59pm
Hello friends,
Can anybody explain why Europeon Call option in Black-Scholes Model has always +ve Vega.
Peter December 30th, 2010 at 9:23pm
Hi Damola, check out the option greeks overview page first and let me know if you have any follow up questions.
damola December 27th, 2010 at 2:56am
hi guys
This page has added to me tremendously on first sight....thumbs up!!!!!!
pls i need to know the relevance of theses greeks cuz i am just starting out in trading.....pls help with direction...tnx
Peter December 19th, 2010 at 9:31pm
Check out the information page on Option Greeks, which will explain why Option Greeks are useful.
madhuri December 18th, 2010 at 3:59am
dear friend,
I couldn't understand why we should know about theta& vega greeks!
Add a Comment