Intro to Option Pricing and Valuation Models
Option pricing models are calculators that are used by option traders to estimate the value of an option contract. The value calculated represents the theoretical, or fair price, for the option given some known (and some estimates) of components that determine an options' worth. A model will then determine a price for an option today based on expected conditions in the future.
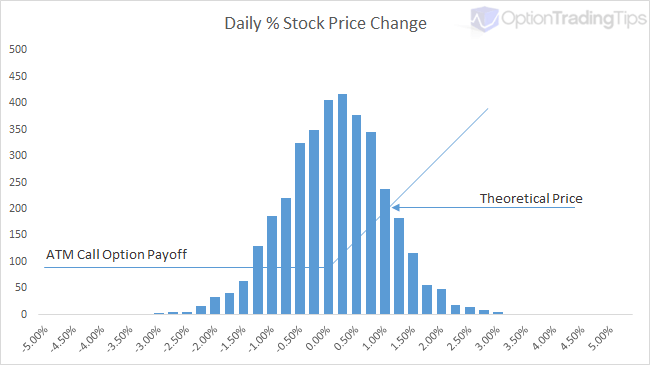
In simple terms, the fair price of an option is the probability of the option expiring in the money multiplied by the option's payoff at the expiration date.
The graph here is an illustration of this concept.
Payoff x Probability
In the above graph of this concept, the vertical bars simulate the daily price changes of a stock over 10 years (with a mean of 0 and standard deviation of 1). The blue line represents the payoff value of a call option at its' expiration date.
The most likely set of price changes occurs around the ATM point and hence ATM options have a delta of 0.50; at this point there is a 50% chance of the stock being above this point by the time the option expires. If the stock has a higher distribution of daily returns (higher volatility) then it is more likely that the option will expire ITM and hence have a higher valuation. Conversely, if the stock's price changes are limited to a narrow trading range (low volatility) then the option price will be lower as there is less likely hood that the stock will jump and expire above the call option's strike price.
Option pricing models are valuation tools that attempt to numerically describe the above graph and output a valuation price for the option in today's terms.
Why Use a Pricing Model?
Generating a single theoretical price is great, especially useful for those looking to value employee stock options. However, a wider usage of pricing call and put options can be found in creating scenarios for option strategy evaluation, calculating implied volatilities from market prices, creating volatility curves, out putting option Greek risk estimations etc.
PnL Analysis
Pricing tools such as my Option Trading Workbook, allows users to enter call, put and stock combinations to form various option strategies. The calculations then enable option strategy evaluation by showing the total scenario payoff at the expiration date as well as the strategy theoretical price. Graphing a combination in this way allows you to view how your profit and loss may change as the price of the underlying stock or stock volatility changes.
Take this as an example. This graph is an option strategy called an Iron Condor. The blue line shows the profit/loss of the strategy at the expiration date depending on underlying stock price. However, the pink line shows the theoretical profit/loss of the condor calculated at today's date. It uses inputs to derive an approximate price for the legs of the options, combines them into the strategy and shows you the curve of your P&L versus the underlying stock price.
Using price modelling in this way helps option traders assess the risks associated with a position before placing the their trades.
Implied Volatility Analysis
If an option contract already has a price i.e there is a bid or ask price in the market, you can use these values into a pricing model to calculate what the volatility input would be assuming all other inputs remain the same. This volatility number is called the implied volatility.
Implied volatility is arguably the most important of all the pricing factors when it comes to option trading. It effectively tells you what volatility the stock will be need to experience if it reaches the strike price by the expiration date. Implied volatility is not flat across the strike range for an expiration date; as an underlying moves higher and lower during a certain time frame, its' underlying volatility must also change as a result.
If you don't have Excel, I have built an online version of this implied volatility calculator.
Risk Estimation (The Greeks)
Because option contracts have a finite life span, their price movements aren't linear like stock or futures prices are. Factors such as underlying price, time to expiry, volatility and interest rates all play a part in influencing the movement of the option contract. Option Greeks are outputs to theoretical pricing models that help traders estimate how these inputs are likely to effect the price of the option. Read more about option greeks.
Types of Models
Due to the complexity of option contracts and the assumptions made in estimating underlying asset prices, there are many different pricing models to choose from. The types of models are built using either Analytical methods (given by closed formulas), and numerical routines (also called finite difference methods). The choice of model can depend on factors such as the option type (vanilla, binary, knock in/out etc) asset type (future, stock, index), option exercise style (American, European) or volatility assumption (normal, log normal, binomial).
Note, most of the option contracts traded by the average retail trader (stock/index/ETFs) are called Vanilla Options, which narrows down the type of model used. Broadly, vanilla options will use either Black and Scholes or a Binomial model for theoretical pricing.
Analytical models are computationally cheap i.e they are fast and effecient at calculating as the result is provided by a closed formula. Numerical models on the other hand are typically more expensive on time and processing as they will use and iterative routine to solve for the option price. I.e. A numerical pricing model such as the binomial model will break down (or iterates) the stock price movement into x number of potentials "steps" where each step is assigned a probability of the stock going up or down according to the volatility and time to expiration. At the end of this tree, all of the possible stock prices are then compared to the strikes at the expiration date. You can read more about this iterative approach here.
Examples of Analytical models:
- Black & Scholes (default for European options)
- Computationally cheap. Not suited for dividend paying stocks.
- Black -76
- Bjerksund
- Barone-Adesi
- Geske
- Kim
- Euro option
Examples of Numerical models:
- Binomial (default for American options)
- Binomial (relative)
- Cox-Ross-Rubenstein
- Tri-nomial
The above example models have been taken from the book The Complete Guide to Option Pricing Formulas by Espen Gaarder Haug. If you would like to see the formulas used for these, feel free to buy his book - it comes with a CD containing spreadsheet examples of many different option models.
Inputs into a Pricing Model
Pricing models require a number of inputs in order to generate a fair value. They are:
- Underlying Price
- The current base price of the stock/future instrument
- Exercise Price
- The strike price of the option being calculated
- Time to Expiration
- The time until the option expires, generally expressed as a decimal per year i.e. 0.25 for a 3 month option
- Volatility
- The expected volatility of the underlying asset, expressed in terms of annual volatility. For an estimate, you can try my historical volatility calculator
- Interest Rates
- The current underlying interest rate, or borrow rate
- Dividends
- Depending on the model, either discrete dividends or a dividend yield is used here
Resources
Historical Volatility Calculator
63 Comments
Peter October 15th, 2014 at 4:48pm
Hi Joseph,
The option pricing spreadsheet is for European options and uses the Black and Scholes model.
For American options you would use the Binomial Model - there are some Excel examples on that page.
Joseph Rosenberg October 15th, 2014 at 11:38am
Your model doesn't say whether it is valuing European or Amercian style stock options. I assume that it is American style (can exercise any time up to the maturity date). Please confirm if so. Thanks,
Joe Rosenberg
Peter June 10th, 2014 at 1:01am
Hi Sam,
Yes, I think using the index to judge overall market volatility is a sound approach!
What option models are you using? Are you using Excel for your tests?
sam June 8th, 2014 at 10:48pm
for my thesis i have to test 5 option pricing models wrt the indian market. i want to evaluate this for options on stocks over two periods one volatile and one relatively stable. is it sufficient if i plot the index values and identify the periods or is there any other method to do so? Also wrt volatility how to calibrate it for my models?
Peter March 31st, 2014 at 6:43pm
Hi,
1. Alot of the FX spot option market is over the counter (OTC) so it will be difficult for a retail trader to obtain live prices. However, there are retail trading firms that claim to support FX options such as Interactive Brokers, FXCM, CMC FOREX and Saxobank.
I use Interactive Brokers and just tried loading an option chain on USD.AUD but the application reported no options listed for that underlying. The live chat is closed for technical reasons so I am unable to ask right now.
Alternatively, if you want to look at options on FX Futures you can do that at the CME website. Most retail brokers should have no trouble supporting these instruments.
2. As the underlying for FX options is a currency pair, you may want to understand the factors affecting both legs that make up the underlying price - the spot price. Also, because the spot price is affected by two currencies, two opposing interest rates are also at work. Here is a slide deck from the ISE exchange that goes through the mechanics of FX Option pricing in more detail;
FX Option Pricing - by Steve Meizinger
3. Yes, I would agree that is a good the general conclusion.
Trainer RC March 27th, 2014 at 8:32am
Hi
I have some questions on FX options,
1. Where is a good place to see real time data of an FX option? in terms of prices.
2. In a real world scenario, where FX option values are calculated daily, what's the best way to explain the price movements? for example if a USD EUR call options value increases, whats the starting point to explain this movement? which attributes should I consider?
3.In an FX option, can I make a general conclusion that the main driver for movements in value is the FX movement? in other words, the current price of the underlying?
Thanks for your time
Peter June 27th, 2013 at 8:26am
Hi Raihaan,
I'm not sure there is enough information to answer the question properly. It sounds like a 1.8000 strike call option versus a 1.8040 spot price, which would mean a loss at expiration of 0.0040. Then you have to subtract the premium, which seems very large at 0.5000. If that is the case then the total loss would be 0.4960.
Also, you'd need to multiply this total loss by the multiplier of the option. Is the multiplier 100,000?
Did you grab this question from a test somewhere?
Raihaan June 26th, 2013 at 8:08am
A call option allows the holder to buy USD100 000 at an exercise exchange rate of 1.8000 (AUD/USD). If the premium paid is 0.5 Australian cents for each USD, calculate the net payoff at the following spot exchange rate:
1.8040.
How would i go about doing this?
Leo April 20th, 2013 at 1:37pm
I sold a put at a 175 strike. On expiration day the stock was trading above 175 by a few cents and below 175 by a few cents. I bought a call to close out the trade before the market closed. The stock closed the day at 174.95. If I had not closed the trade would I have been put the stock trading that close to the strike price. How close to the strike price can the sold put expire worthless.
Peter March 2nd, 2013 at 3:14am
Hi Peter C,
No additional capital is required in this case as you are just unwinding or closing out an existing position.
Currently you are long 2 contracts and after selling 2 contracts your position will be zero.
You would only need to be concerned about capital if your sold short the 2 contracts.
Add a Comment