Intro to Option Pricing and Valuation Models
Option pricing models are calculators that are used by option traders to estimate the value of an option contract. The value calculated represents the theoretical, or fair price, for the option given some known (and some estimates) of components that determine an options' worth. A model will then determine a price for an option today based on expected conditions in the future.
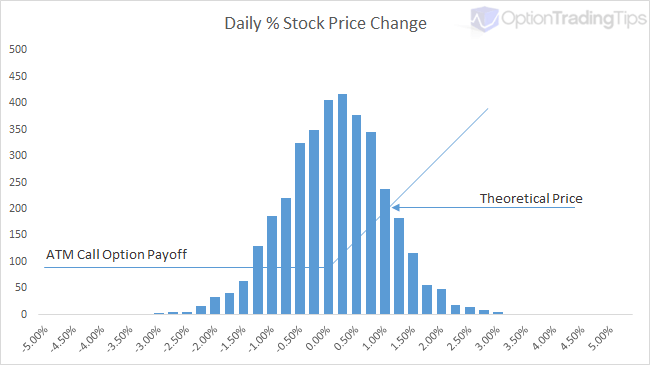
In simple terms, the fair price of an option is the probability of the option expiring in the money multiplied by the option's payoff at the expiration date.
The graph here is an illustration of this concept.
Payoff x Probability
In the above graph of this concept, the vertical bars simulate the daily price changes of a stock over 10 years (with a mean of 0 and standard deviation of 1). The blue line represents the payoff value of a call option at its' expiration date.
The most likely set of price changes occurs around the ATM point and hence ATM options have a delta of 0.50; at this point there is a 50% chance of the stock being above this point by the time the option expires. If the stock has a higher distribution of daily returns (higher volatility) then it is more likely that the option will expire ITM and hence have a higher valuation. Conversely, if the stock's price changes are limited to a narrow trading range (low volatility) then the option price will be lower as there is less likely hood that the stock will jump and expire above the call option's strike price.
Option pricing models are valuation tools that attempt to numerically describe the above graph and output a valuation price for the option in today's terms.
Why Use a Pricing Model?
Generating a single theoretical price is great, especially useful for those looking to value employee stock options. However, a wider usage of pricing call and put options can be found in creating scenarios for option strategy evaluation, calculating implied volatilities from market prices, creating volatility curves, out putting option Greek risk estimations etc.
PnL Analysis
Pricing tools such as my Option Trading Workbook, allows users to enter call, put and stock combinations to form various option strategies. The calculations then enable option strategy evaluation by showing the total scenario payoff at the expiration date as well as the strategy theoretical price. Graphing a combination in this way allows you to view how your profit and loss may change as the price of the underlying stock or stock volatility changes.
Take this as an example. This graph is an option strategy called an Iron Condor. The blue line shows the profit/loss of the strategy at the expiration date depending on underlying stock price. However, the pink line shows the theoretical profit/loss of the condor calculated at today's date. It uses inputs to derive an approximate price for the legs of the options, combines them into the strategy and shows you the curve of your P&L versus the underlying stock price.
Using price modelling in this way helps option traders assess the risks associated with a position before placing the their trades.
Implied Volatility Analysis
If an option contract already has a price i.e there is a bid or ask price in the market, you can use these values into a pricing model to calculate what the volatility input would be assuming all other inputs remain the same. This volatility number is called the implied volatility.
Implied volatility is arguably the most important of all the pricing factors when it comes to option trading. It effectively tells you what volatility the stock will be need to experience if it reaches the strike price by the expiration date. Implied volatility is not flat across the strike range for an expiration date; as an underlying moves higher and lower during a certain time frame, its' underlying volatility must also change as a result.
If you don't have Excel, I have built an online version of this implied volatility calculator.
Risk Estimation (The Greeks)
Because option contracts have a finite life span, their price movements aren't linear like stock or futures prices are. Factors such as underlying price, time to expiry, volatility and interest rates all play a part in influencing the movement of the option contract. Option Greeks are outputs to theoretical pricing models that help traders estimate how these inputs are likely to effect the price of the option. Read more about option greeks.
Types of Models
Due to the complexity of option contracts and the assumptions made in estimating underlying asset prices, there are many different pricing models to choose from. The types of models are built using either Analytical methods (given by closed formulas), and numerical routines (also called finite difference methods). The choice of model can depend on factors such as the option type (vanilla, binary, knock in/out etc) asset type (future, stock, index), option exercise style (American, European) or volatility assumption (normal, log normal, binomial).
Note, most of the option contracts traded by the average retail trader (stock/index/ETFs) are called Vanilla Options, which narrows down the type of model used. Broadly, vanilla options will use either Black and Scholes or a Binomial model for theoretical pricing.
Analytical models are computationally cheap i.e they are fast and effecient at calculating as the result is provided by a closed formula. Numerical models on the other hand are typically more expensive on time and processing as they will use and iterative routine to solve for the option price. I.e. A numerical pricing model such as the binomial model will break down (or iterates) the stock price movement into x number of potentials "steps" where each step is assigned a probability of the stock going up or down according to the volatility and time to expiration. At the end of this tree, all of the possible stock prices are then compared to the strikes at the expiration date. You can read more about this iterative approach here.
Examples of Analytical models:
- Black & Scholes (default for European options)
- Computationally cheap. Not suited for dividend paying stocks.
- Black -76
- Bjerksund
- Barone-Adesi
- Geske
- Kim
- Euro option
Examples of Numerical models:
- Binomial (default for American options)
- Binomial (relative)
- Cox-Ross-Rubenstein
- Tri-nomial
The above example models have been taken from the book The Complete Guide to Option Pricing Formulas by Espen Gaarder Haug. If you would like to see the formulas used for these, feel free to buy his book - it comes with a CD containing spreadsheet examples of many different option models.
Inputs into a Pricing Model
Pricing models require a number of inputs in order to generate a fair value. They are:
- Underlying Price
- The current base price of the stock/future instrument
- Exercise Price
- The strike price of the option being calculated
- Time to Expiration
- The time until the option expires, generally expressed as a decimal per year i.e. 0.25 for a 3 month option
- Volatility
- The expected volatility of the underlying asset, expressed in terms of annual volatility. For an estimate, you can try my historical volatility calculator
- Interest Rates
- The current underlying interest rate, or borrow rate
- Dividends
- Depending on the model, either discrete dividends or a dividend yield is used here
Resources
Historical Volatility Calculator
63 Comments
Aman January 16th, 2012 at 12:37pm
The spreadsheet ask for the "historical volatility" for one of my inputs. How can I determine/calculate the historical volatility? Thanks.
k December 17th, 2011 at 7:36am
thank u peter ..
could u tell me what one can do wen an option is under priced or over price ? should we buy it or should we sell what we have or hold the position ...
Peter December 14th, 2011 at 4:16pm
Hi K, apologies for the delay - I missed your first comment.
An overpriced or underpriced option occurs when you have used an option pricing model to calculate a theoretical price given certain inputs to the model e.g. stock price, interest rates, dividends, strike price, expiration date and volatility.
Out of the above inputs all are known except the volatility, so when the market price of an option is higher than what has been calculated by an option model, this means that the market is "implying" a higher expected volatility for the underlying stock from the current point until the expiration date.
If the market price of the option is lower than the theoretical price then the market is implying a lower expected underlying volatility.
k December 14th, 2011 at 8:25am
hi peter,
how do we know that an option is overpriced or under priced ? n what implication does it have ?
Tiburon December 3rd, 2011 at 9:20am
Good work Peter.....Keep it up!! You are a great help to beginners.
k December 3rd, 2011 at 12:59am
hi peter,
how do we know that an option is overpriced or under priced ? n what implication does it have ?
Peter November 27th, 2011 at 5:32pm
Hi Omkar,
Please see my option pricing spreadsheet.
Omkar Kulkarni November 26th, 2011 at 3:06am
Hello Peter
Kindly provide me excel format for better understanding & study.
regards
catfish November 3rd, 2011 at 7:24am
Thanks Peter! Perfect; thanks for the clear explanation!
Peter November 2nd, 2011 at 5:03pm
Hi Catfish,
Adj Close is the closing price adjusted for dividends and stock splits.
Px Change is the daily percentage change.
The Volatility column measures a range of Px Changes according to the cell B3. So the cells are blank until enough data is available to calculate.
The values directly below the input cells are;
Close = Current closing price of the stock.
Current = Current historical volatility value.
Average = Average of the historical volatility for the data set.
Maximum = Maximum volatility for the period.
Minimum = Minimum volatility for the period.
Add a Comment