How to Use the PC Ratio to Forecast Market Direction
Many traders use options for directional bets; buying calls when bullish and buying puts when bearish. Therefore the volumes associated with each are often used to determine the overall view of what the market expects in terms of price action.
The Put Call Ratio simply takes the number of put options traded and divides it by the number of call options. The higher the number, the more negative the directional bias is for that asset.
E.g. if a PCR shows 2.5, then this means that there has 2.5 times more interest in put options than calls. Traders generally take this to mean that there are predominately more traders opening long positions in puts than there are longs in call options. While it is true that for every buyer there is a seller, the market view is that open positions for options tend to be on long side for options as naked short option positions are very risky. Naked shorts are also more expensive from a margin perspective too and are not as likely to be used as a directional bet by most retail traders.
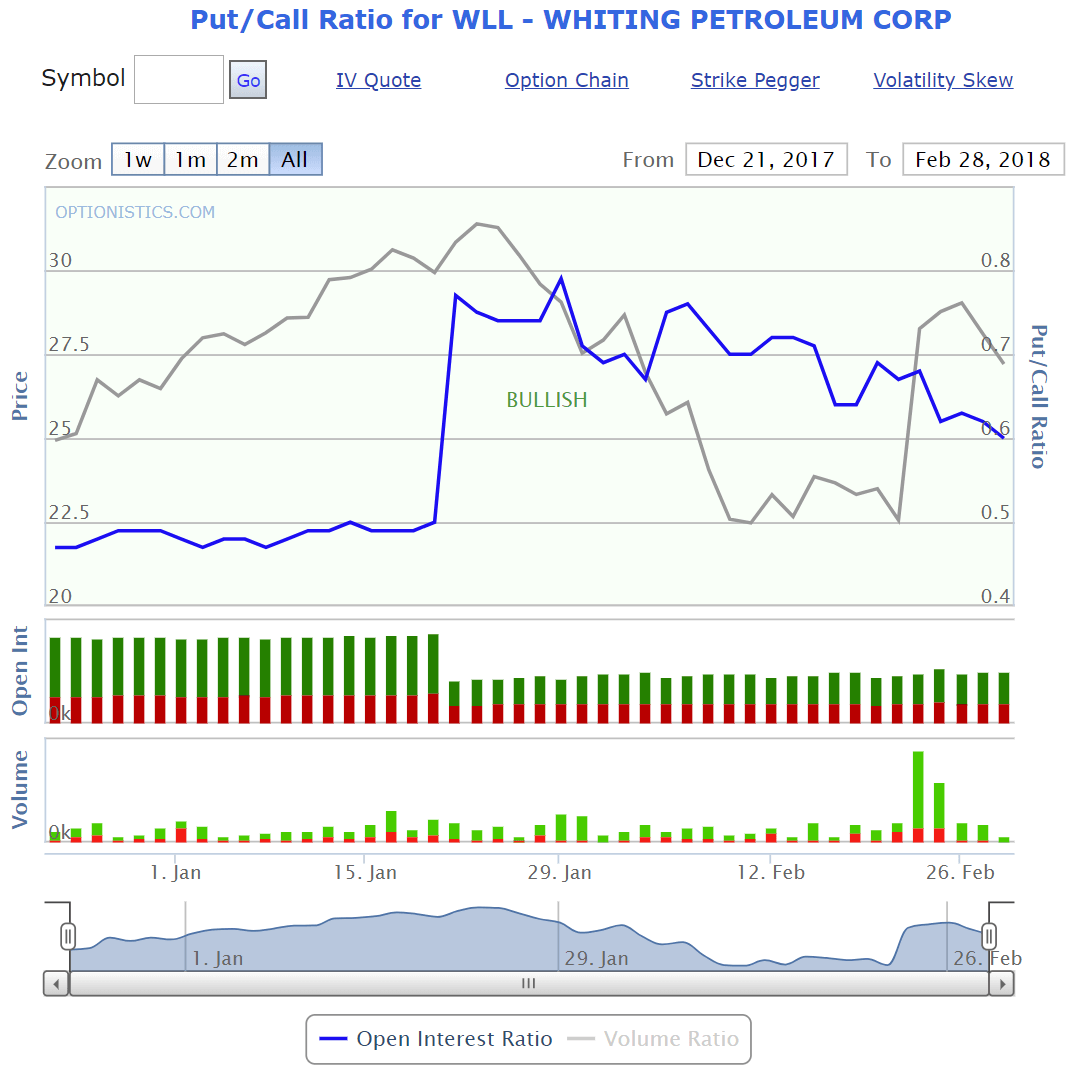
PCR moving to bearish levels before the stock price drops.
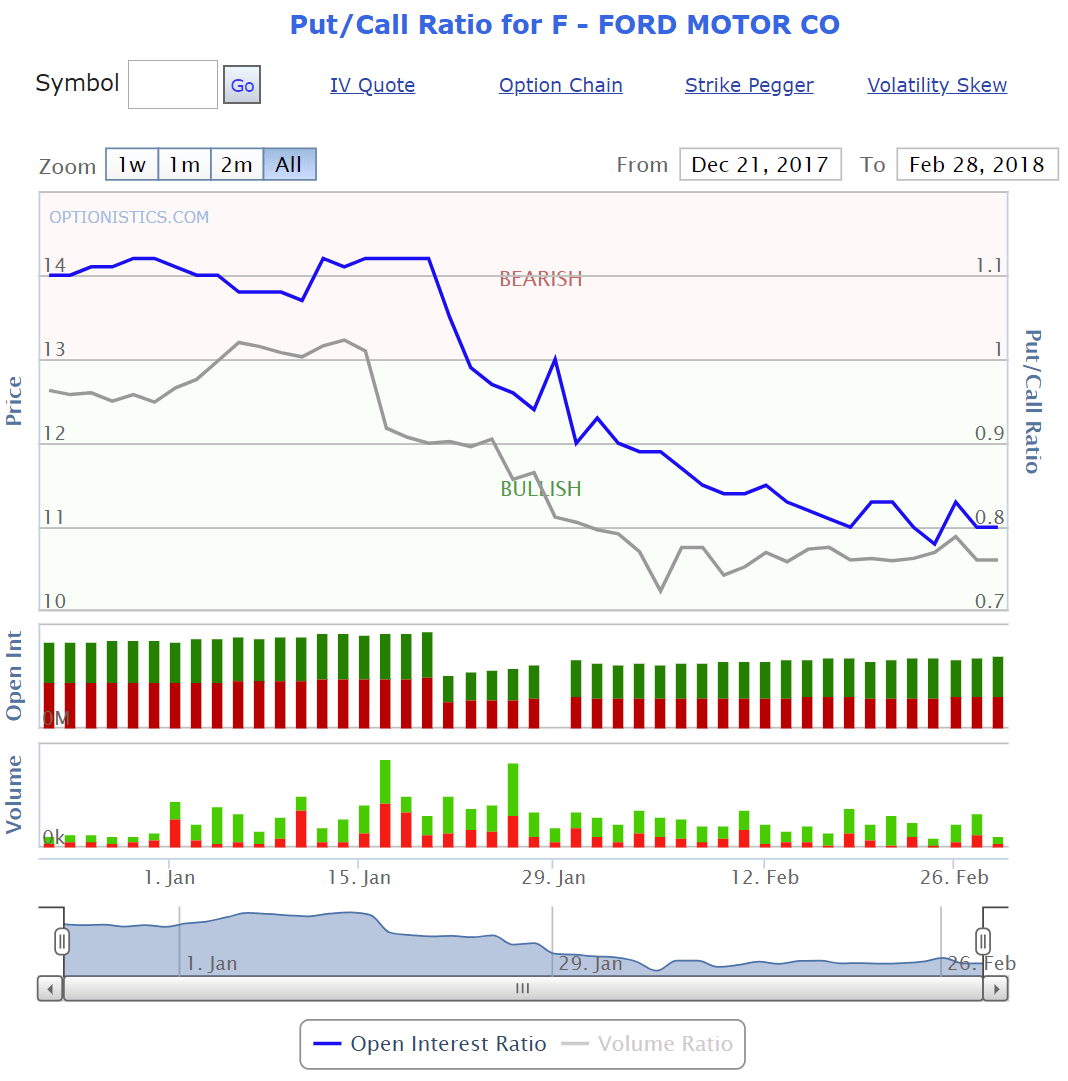
PCR moving into bullish range while stock price levels out.
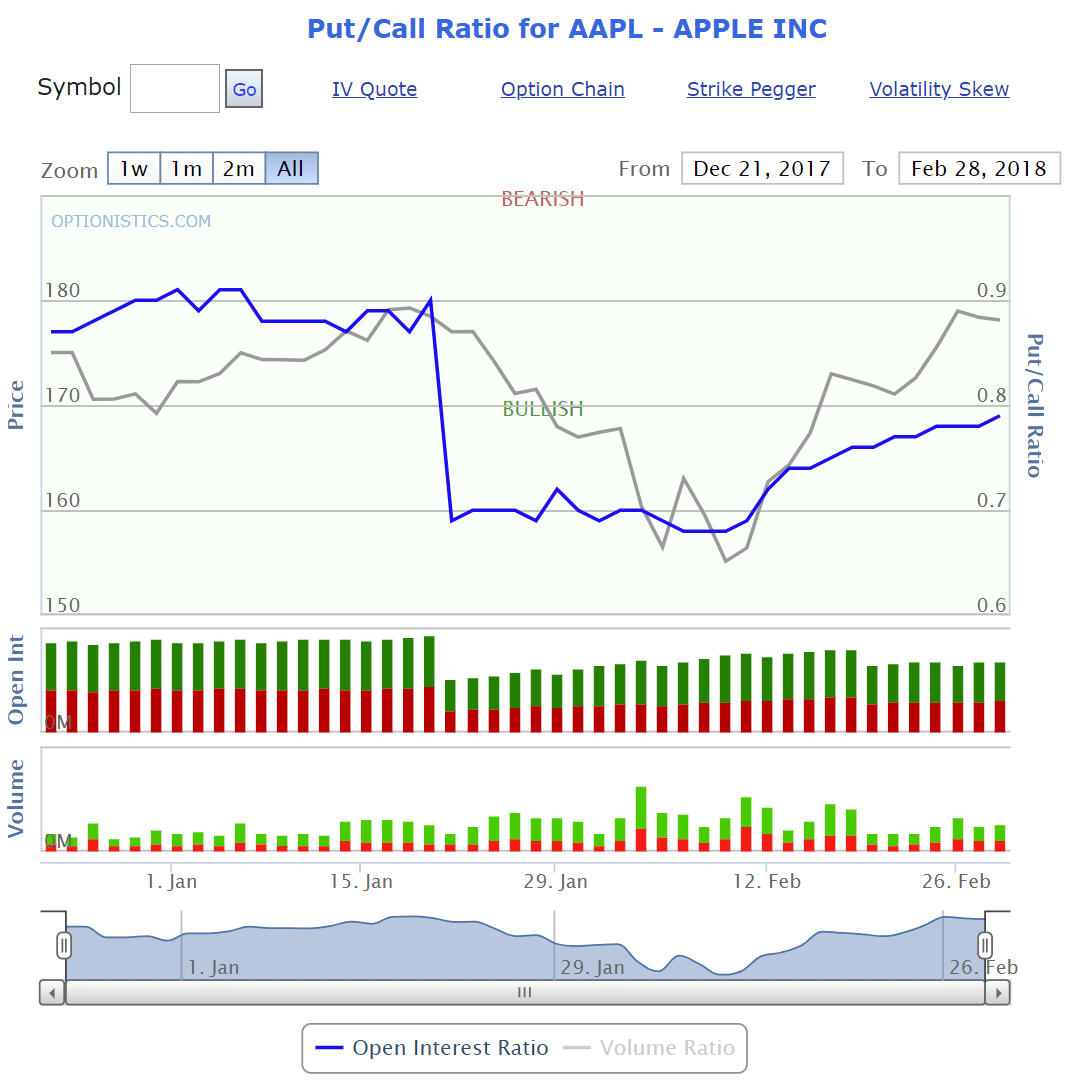
PCR drops sharply before stock price rallies.
Strike, Total Volume or Open Interest
There are a few ways to look at PCR; using a single strike price, the total volume for expiry/underlying or open interest per expiry/underlying.
1. Per Strike
Looking at the ratio of puts to calls on a per strike level is really only useful on stocks with illiquid options. That is, where the volumes traded are typically low.
When the general volume is low, a huge difference between calls and puts on one strike will be obvious and could be an indicator that someone knows something the rest of the market doesn't.
This type of volume analysis is popular for retail traders to use on stocks leading up to a major announcement, such as an earnings report. The Option Scanner is one such product, which scans tens of thousands of strikes in seconds to produce a small shortlist of possible breakout stocks.
2. Aggregated Volume
While a single strike approach is useful for short term busts in price, it isn't considered as useful in determining general sentiment or directional bias from a holistic perspective.
When looking for an overall "mood" of a stock, traders look for indicators that provide a broad view from the majority of the participants in the market. To achieve this when looking at put call ratios, the idea is to lump strikes and/or expiration dates together to view the total traded volume difference more broadly. If a single strike shows a slightly bullish PCR but all other strikes are indicating a strong bearish signal, it is clear that the majority of the volume traded by the rest of the market is looking for that stock to take a dive before the expiration date for those options.
3. Total Open Interest
Looking at volume traded does indeed give a good indication of movements in calls to puts, but the best indication of the position held by the market is in the number of outstanding contracts, or rather the Open Interest. While traded volume is handy, it won't be able to show how much of the volume was the result of scratch trades i.e where same trader buys but then sells back the same amount of options. Or, perhaps the volume traded was used to reduce an existing position.
The best look at the inventory taken by the market in relation to the ratio of puts to calls is by looking at the Open Interest Put Call Ratio. The Open Interest PCR will show you how much of the traded volume has been transferred into an actual position in each strike. When looked at from an expiry or underlying level, it can show you just how much the majority of the market is invested in either calls or puts.
Where to Get PCR Data
Historical options data isn't easy to come by, nor easy to store and analyse. So, there aren't too many websites that provide this data for free.
Brokers who specialize in supporting options trading will most definitely provide volume and option interest data for options, e.g. my broker Interactive Brokers provides a lot of options data but funnily enough doesn't provide historical PCR numbers. However, I found the following sources for you to check out. I'd say Optionistics is the better of the three.
0 Comments
No comments yet — be the first!
Add a Comment