Collar
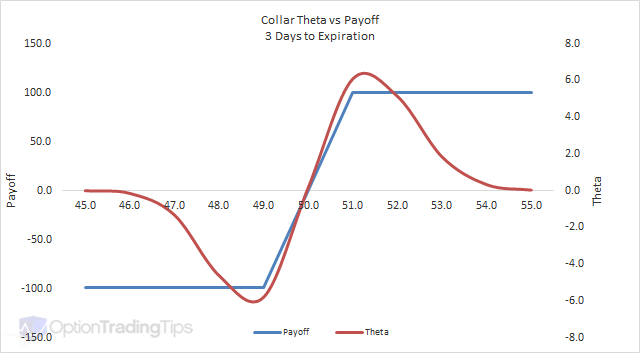
A Collar is being long the underlying asset while shorting an OTM call and also buying an OTM put with the same expiration date.
The Max Loss is any loss taken on the stock +/- the premium for the options. The loss on the stock will be the purchase price of the stock minus the strike price of the put option (as you will exercise at that price) plus the net premium paid or received.
The Max Gain The profit of the stock +/- the premium for the optoins. The profit on the stock will be the strike price of the call option minus the purchase price of the stock (as you will be exercised and deliver at the strike) plus the net premium paid or received.
Mc ClaneDecember 30th, 2012 at 2:11pm
My comment might be a little off the subject but I thought this might be the best place to ask. I have millions of penny stocks in about 8 companies (OTCBB & pinksheets)I've been holding the stocks for over 7 years now and none of them have had impressive returns therefore wouldn't like to sell'em.. I have the understanding that OTCBB & pink sheets stocks don't trade options. My question is what can I do with these? Is there a strategy fit fot these kind of situations? Greetings!
PeterOctober 29th, 2012 at 4:41am
Hi Arthur,
Apologies for the delay in responding!
1) It is risky in the sense that you have no upside or downside protection. But this is no more of risky position than holding the stock outright as your position resembles a synthetic long stock.
2) No, you will "add" to the risk if you "bought" the stock. If you "sold" the stock you would be short a collar.
3) A Long Synthetic.
4) Nothing if you bought, but if you sold the stock it would be a Short Collar.
5) You could look to buy the stock and the sell the call and buy the put for a Long Collar.
ArthurOctober 9th, 2012 at 3:30pm
Hey,
I bought a Nov 2.5 Call and sold a Feb 5 put, both on BSDM (stock closed at 2.02 today). Got a few of questions:
1) Is this an unreasonably risky trade?
2) Can I mitigate the risk by buying the stock at say, $2.08?
3) What strategy is it called without the stock?
4) What strategy is it called if I buy the stock?
5) Is there a better way to have done this?
Thanks for your responses (I just discovered your site today... I would have made a better trade had I found it earlier). Great site!
PeterAugust 13th, 2012 at 7:48pm
Hi Marian,
If you "must" protect the total $1,000,000 then best not to trade at all - leave the money in the bank and earn interest.
If you wanted to put on a collar you will need to buy some stock first and then also sell call options to offset the purchase of the puts. However, with a collar you will still have some downside risk to consider, which is the maximum loss on the trade if the market sells off.
If you want to buy stocks and are looking for downside protection then you could also look at a Protective Put.
marianAugust 11th, 2012 at 11:06am
Hi Peter,
Suppose I had $1,000,000 and in 1 year I still want to have at least the same amount. If possible, I want to make some profit but I must protect those $1,000,000. Would you recommend a collar option strategy in this case?
Thanks for your help!
PeterApril 25th, 2012 at 10:26pm
Yes, I see that the description above can be a bit confusing. I've modified it so it is a little clearer.
In your example above, if the stock is below K1 then your loss will any loss on the stock +/- the premium for the option legs. So, the purchase price of the stock minus the K1 (as you will exercise and sell the stock at that price) plus premium received (or less premium paid).
kamalApril 24th, 2012 at 4:52am
Hi Peter,
First thanks for this very helpfull website.
I can't understand when you say that the maximum loss would be : "Limited to the difference between the two strikes less the net premium paid or received less the loss on the stock leg".
If you're long the stock S and long OTM put with strike K1 and short OTM call with strike K2 as such k1 < k2.. when your stock price is less than k1 then your PL would be K1 + premium paid/received for both call and put. is it right? or am i missing something here?
Thanks for your reply.
PeterNovember 17th, 2011 at 4:57am
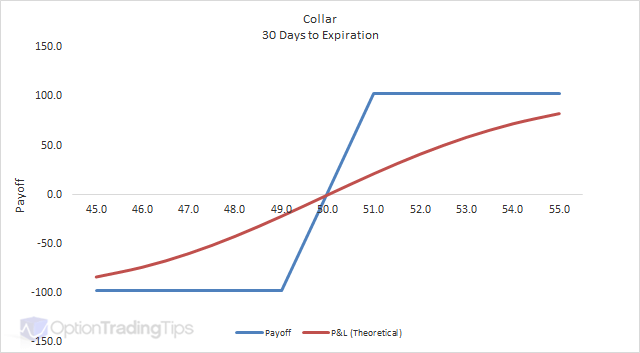
The graph is correct - a collar just has a similar payoff profile as a bull spread.
You can use my option pricing spreadsheet and build the individual legs to verify if you like.
SamNovember 17th, 2011 at 4:41am
The graph is wrong, this is a bull spread that we can see on it and not a collar
PeterJune 22nd, 2011 at 5:37pm
Hi Pierre, yes, both have the same payoff profile, however, the prices paid for the options and hence the max profit/loss will be different.
PierreJune 22nd, 2011 at 8:31am
Hi Peter,
Am I right if I say that a Collar and a Protected Covered Call (section Covered Call) are the same product or there is a difference ?
Thank you
PeterDecember 17th, 2010 at 10:04pm
The x-axis represents the stock price and the y-axis shows the profit and loss. The blue line is the P&L at the expiration date while the pink line is the theoretical P&L with 60 days left to expiration.
ajayDecember 17th, 2010 at 9:49am
i cudn't understand..the graph..what is P&L..what does vertical and horizontal axes stand for..plz make it clear
PeterAugust 19th, 2010 at 6:02pm
Hi Phil, by the definition of a collar the options have to belong to the same expiration date. I actually do not know what this type of spread would be called. I checked Natenburg's Option Volatility and Pricing and couldn't find it mentioned there either. I would guess that it's just a type of diagonal spread.
I'm not sure about your second question. Do you mean can you still sell call options prior to the expiration of the 6 month put option?
PhilAugust 19th, 2010 at 1:38am
If the call I sell and the put I buy do not have the same expiration month, is it still a "collar"?
If I buy a six month put, can I not get the premiums on two three month calls during that time?
PeterJuly 24th, 2010 at 9:17am
Optionable underlyings have more than one expiration month. For example, at the time of writing, MSFT have electronic tradable options that expire January 2012.
Anyway, the graphs are just for illustration purposes.
venkatJuly 16th, 2010 at 12:21pm
how can we have 60 days left to expiration as the contracts are monthly
PeterJune 10th, 2010 at 5:55am
It's the theoretical P&L calculated with 60 days left to expiration.
JHJune 10th, 2010 at 3:35am
I don't understand the "P&L 60 days" part of the graph. Is that explained anywhere?
PeterApril 29th, 2009 at 8:22pm
Hi Sarish,
OTM = Out of the Money
ITM = In the Money
ATM = At the Money
SarishApril 28th, 2009 at 4:18pm
What does OTM stand for? Thanks for your response:)
AdminAugust 23rd, 2008 at 6:28pm
Yep, you're right Nitesh. I've changed the typo as indicated.
NiteshAugust 22nd, 2008 at 2:32am
Under components you say, that we should long OTM Put option, however under characteristics is mentioned that it is ideal for the investors who own the stock and are looking for minimise their downside risk by WRITING put option. I guess instead of WRITING put uption it should be buying the put option.
Thank you
Add a Comment