Put Time Spread
| B/S | Strike | Type | Price |
|---|---|---|---|
| Sell 1 Front Month | $35 | Put | $1.00 |
| Buy 1 Back Month | $35 | Put | $1.41 |
| Net Debit | $30 | ||
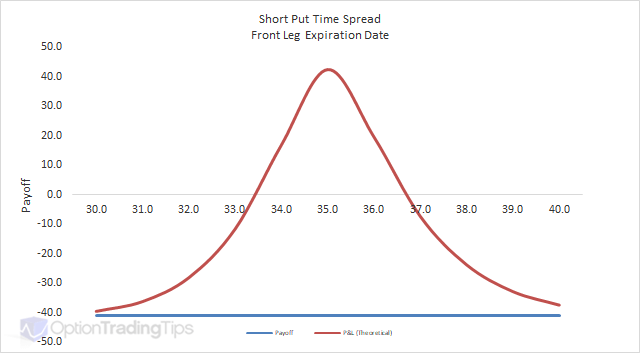
A Put Time Spread is a short front month put option and long one far month put option. (i.e. the option you sell is to be closer to expiration than the option you are buying).
The Max Loss is limited on both down and upside for market direction.
The Max Gain is limited.
Characteristics
When to use: When you are bearish on volatility and neutral to bearish on market price.
Note that with the payoff graph above I have shown the net theoretical result only at the first expiration date when with the underlying trading at 70, which is the best result: the near month call will expire worthless and you will still have a long AT put position.
A put time spread is similar to Call Time Spread except that you want the market to decrease rather than increase. So, a put time spread is used to take advantage of time decay. However, due to the risk involved in selling naked options, a time spread protects the position buy buying an option in the next month.
It is best to implement a time spread when there is < 30 days to expiration in the front month. Also, look to sell options that are out-of-the-money.
Put Time Spread Greeks
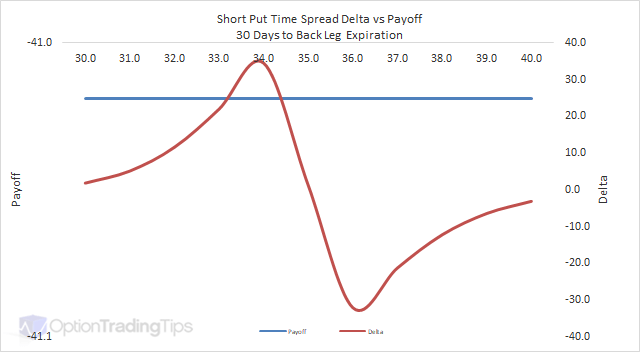
Delta
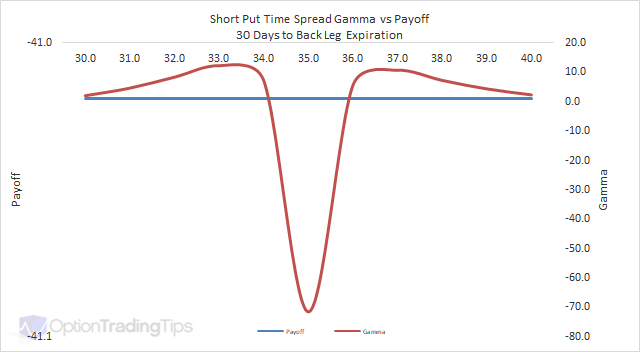
Gamma
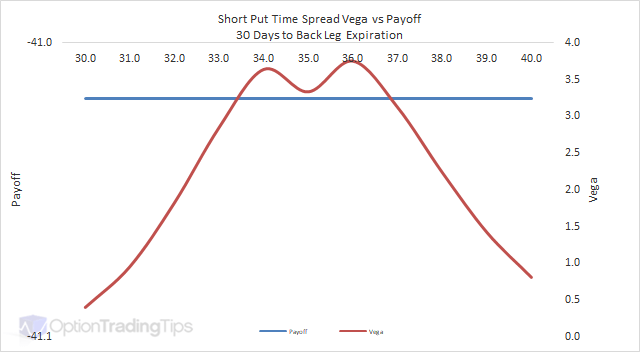
Vega
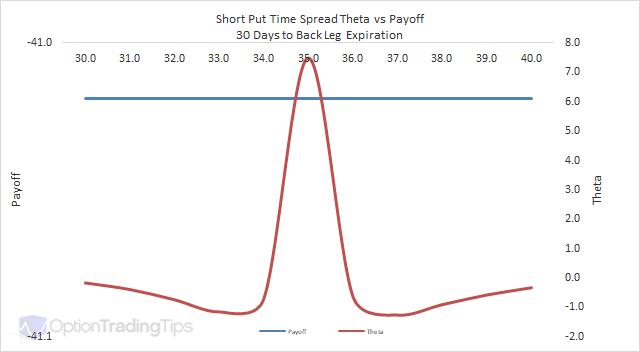
Theta
0 Comments
No comments yet — be the first!
Add a Comment