Long Put Spread (BTU)
Market Close July 3
| Symbol | Position | Price | Close | P&L |
|---|---|---|---|---|
| BTU Long Put Spread | ||||
| BTU Jul02 $2.5 Put | -5 | 0.097 | 0.63 | -266.5 |
| BTU Jul02 $3 Put | 5 | 0.362 | 1.13 | 384 |
| Total | 1.325 | 2.5 | 117.5 |
12th June, 2015
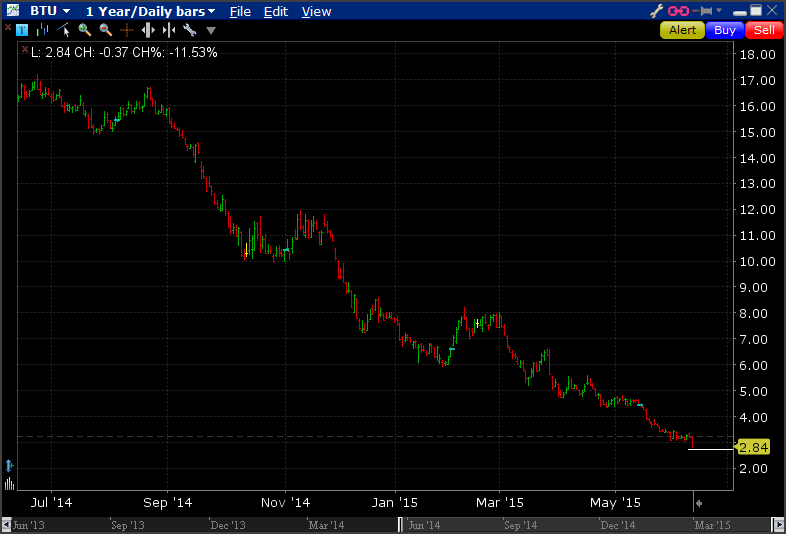
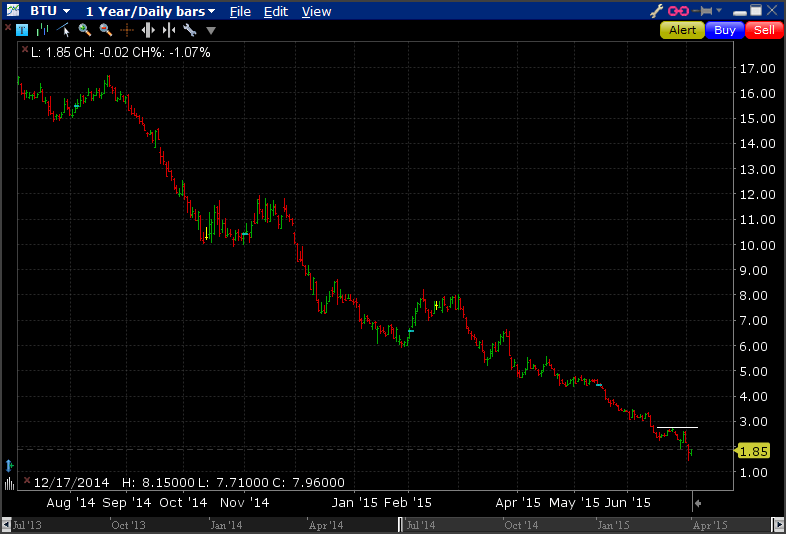
I noticed Peabody Energy (BTU) on my high volatility scans post Thursday's trading session showing implied vols of around 100%. The stock has been in a strong down trend for about ten months now and closed Thursday's session out at at 2.77 but has upticked slightly to 2.84 in after hours trading. Earnings aren't out until 22nd July.
My bet is that BTU will be lower than $2.75 over the next three weeks, prior to earnings release.
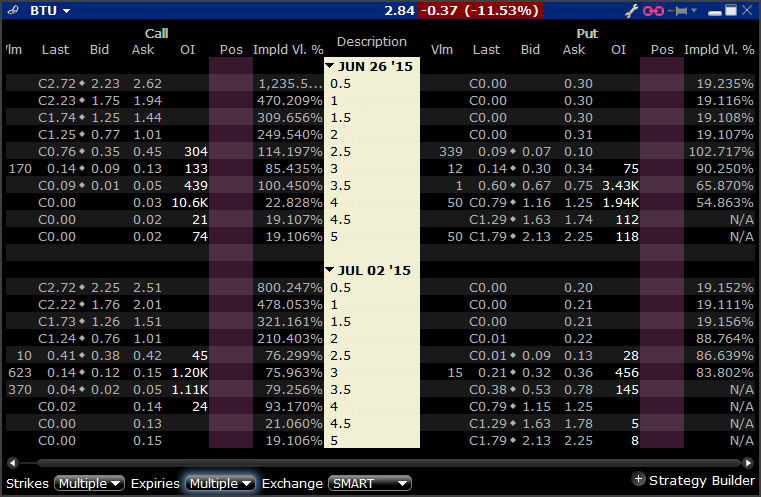
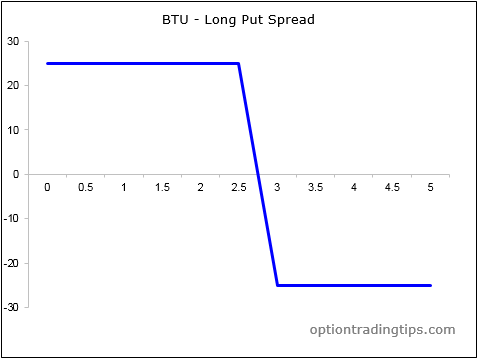
Looking at the 2nd July expiration series I plotted out long put spread using the $3 and $2.5 strikes. I.e. Buy $3 Put and Sell $2.5 Put. Using the mid point of the closing prices from Thursday gives me a net debit of $25 per contract. I traded 5 lots though, so $125 in total.
My max gain is also $25 per lot - $125 total.
Seems an easy play to go with the trend here, not just looking at the chart but also a lot of negative sentiment about them in the press;
BTU Stock Target Lowered at Barclays
However, there doesn't seem to be a lot of interest in the downside puts;
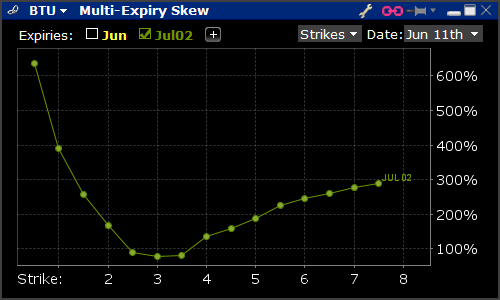
There's more open contracts for the $3 and $3.5 calls than $3 and below put options. Having said that though, check out the volatility skew for the July 2 expiry;
Massive downside skew here, indicating higher quotes on the puts relative to the calls. These are just the quoted prices though - as seen above not much volume and open interest has been taken on the downside puts.
This will be a good real money test of some basic analysis here; charts and news vs open volume and open interest.
Update 15th June
After being filled at my price during Friday's session, the spread closed at 0.425, up 0.16 per contract while the stock was down 9%. My P&L on the trade at Friday's close was $80.
One day later, the stock is down again, this time by 5.5%, lower still then when I initiated the trade. However, the put spread value (against bid/ask) has dropped to 0.31. P&L lower by $57.50 to +$22.50.
This is what makes options confusing sometimes...the market goes your way but you still don't seem to make any money while the trade is open. I think the reason for the spread price dropping is caused by the volatility.
Implied vols have spiked for the downside puts and the increase on my short $2.50 put is larger than the increase on the long $3 put. Here is the skew graph;
The stock is now below the $2.75 level, so that's a good sign.
Update 16th June
BTU stock traded sideways during Tuesday's session to end the day unchanged. However, the shares upticked slightly in after-hours trading by 2%.
The market price for the put spread has jumped to 0.475 (according to my statement), which is a great result after only a few days. The maximum net price this put spread can reach is 0.50 (difference between the strike prices).
Total P&L is now $105 for the trade.
With 2 weeks to go, I think it's worth exiting this trade now with a decent profit rather than holding to expiry. I will put in an order to sell back the spread at 0.45 and see how I go during Wednesday's session - maybe my exit price is too high. We'll see.
Update 17th June
My sell order for the put spread wasn't filled. Stock up 3.35% to close at $2.47. Spread price is now valued at 0.405. Open profit dropped a little to $70.
Update 3rd July
BTU closed the week out at $1.87. The put spread expired at its' max value, less the premium paid leaves a profit after 5 contracts of $117.50. Here's the chart after the close on Friday;




There are zero comments
Add a Comment