Expiration Summary 17th June, 2016
A very disappointing result from the trades closed out this expiration. They all started out so well...especially the CY Straddle. I had almost tripled my initial spend at one point but the stock tanked soon after and I closed it out at a loss.
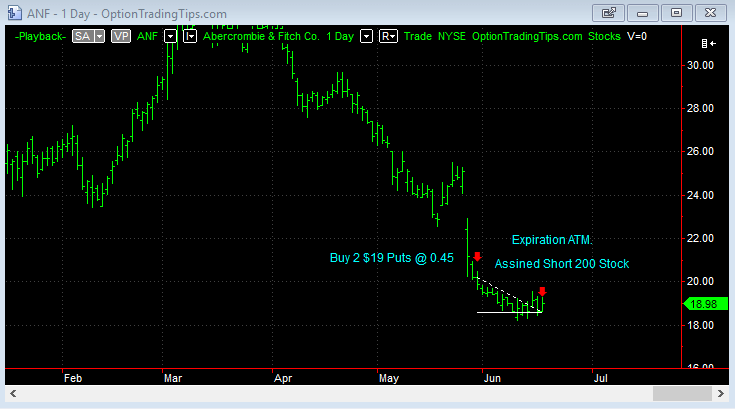
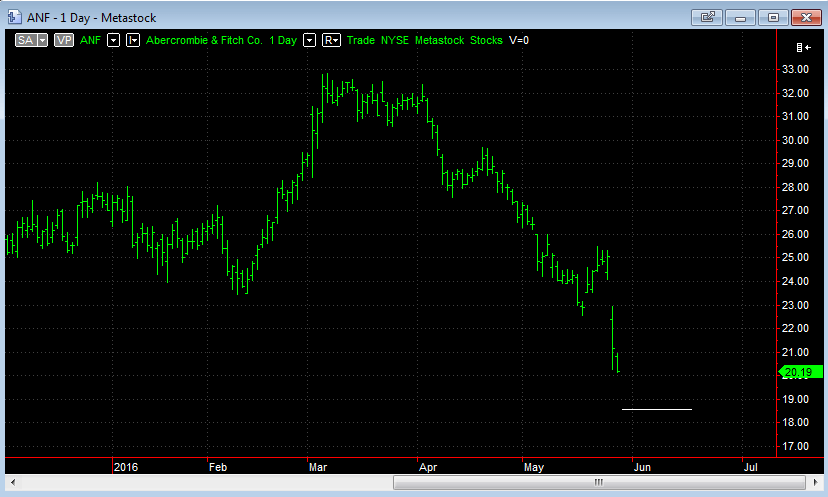
The only profitable one was ANF - although the result is a little misleading as to the outcome of the initial option trade. The put expired right on the strike, which meant I lost all of the premium and then I was assigned a short position in the stock. I then sold an ATM put and collected the premium from that. The stock dropped and I was then obligated to buy the stock at the strike price, cancelling out the short stock at the same price. The premium I kept from the protecting short put ended up being the profit.
In total, the trades below lost $335.
These trades, as well as the current set, have got me thinking more about spending more time thinking about better trade management and better exit strategies. I'm not saying to exit as soon as they make a profit, but at least be more considered about how to mange each trade as they progress instead of just waiting until they expire.
| Trade | Open | Days | P&L |
|---|---|---|---|
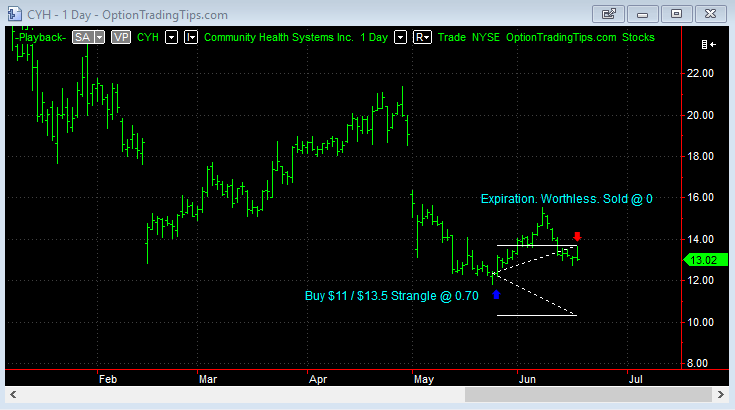
| CYH Long Strangle | 25-May-16 | 23 | -110 |
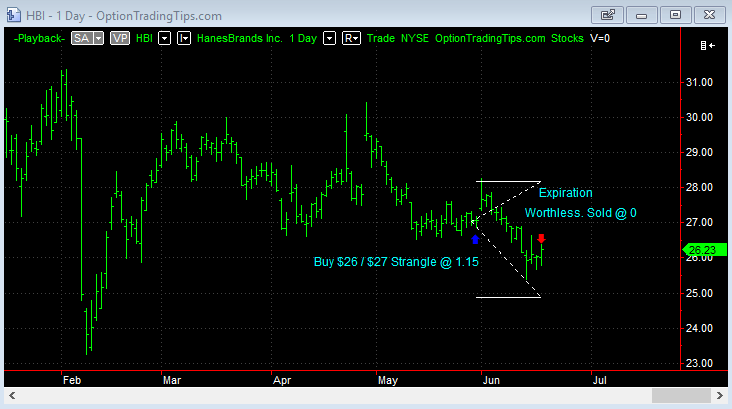
| HBI Long Strangle | 31-May-16 | 17 | -115 |
| ANF Long Put | 31-May-16 | 17 | -90 |
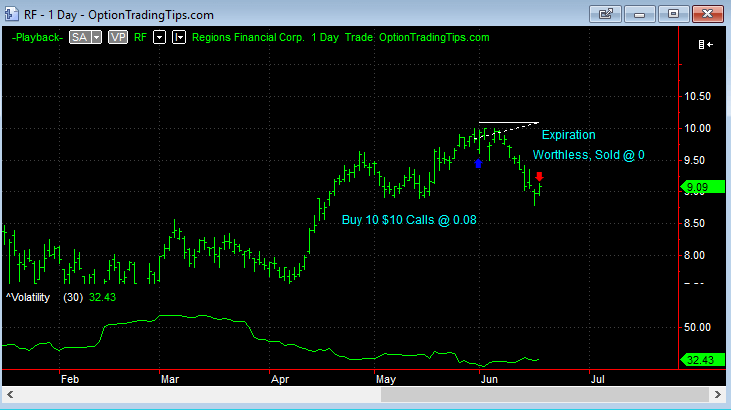
| RF Long Call | 1-Jun-16 | 16 | -80 |
| ANF Covered Put | 17-Jun-16 | 7 | 60 |
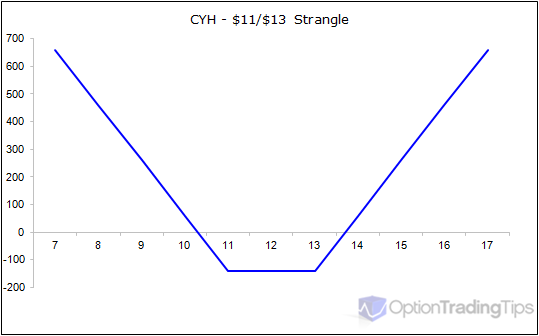
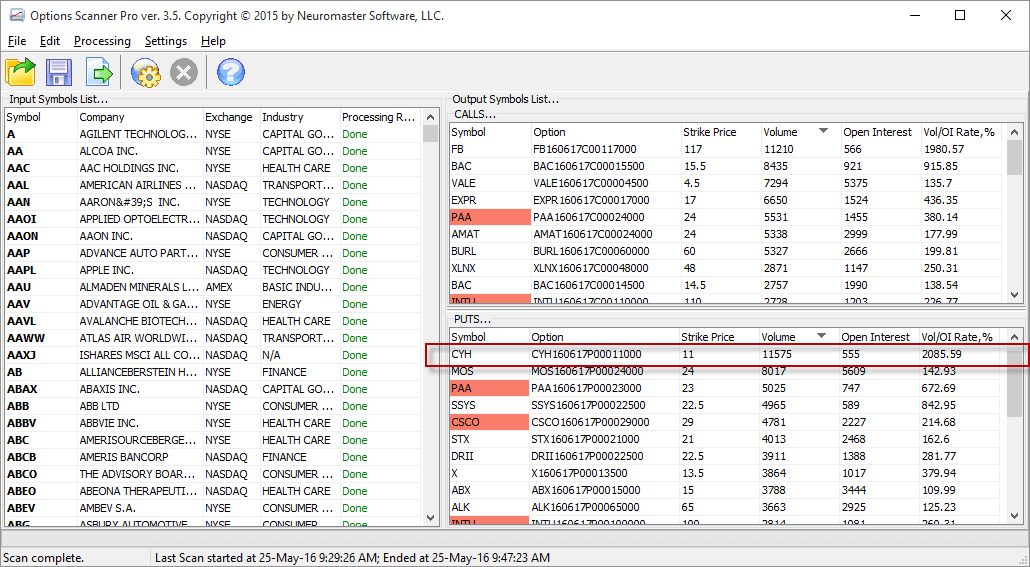
CYH Long Strangle
| Stock | CYH |
|---|---|
| Position | Long Strangle |
| Trade Length | 23 Days |
| Capital | $110.00 |
| P&L | -$110.00 |
May 25
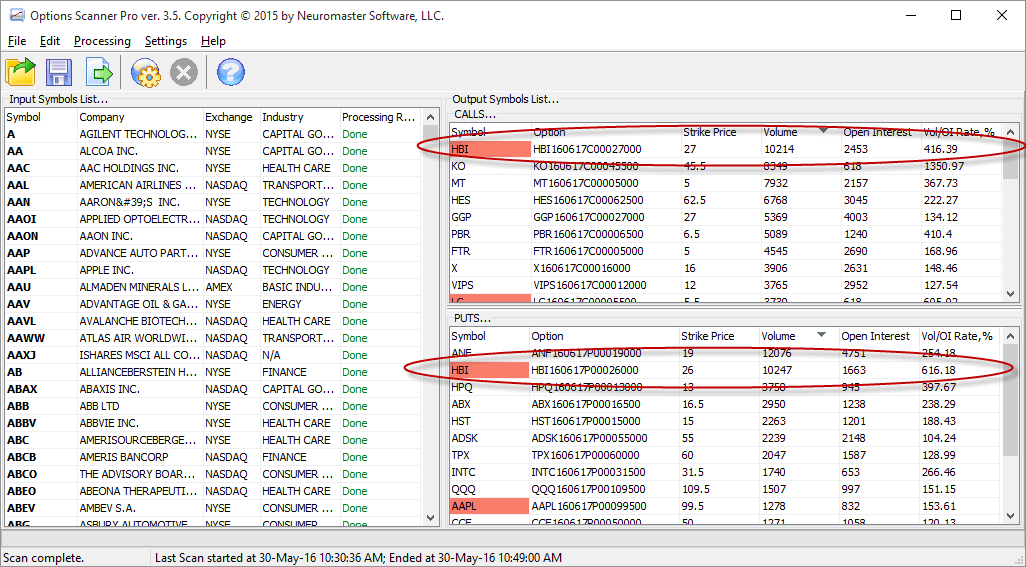
Bought 2 Strangles on CYH due to volume alerts on the $13 calls and $11 puts.
HBI Long Strangle
| Stock | HBI |
|---|---|
| Position | Long Strangle |
| Trade Length | 17 Days |
| Capital | $115.00 |
| P&L | -$115.00 |
May 31
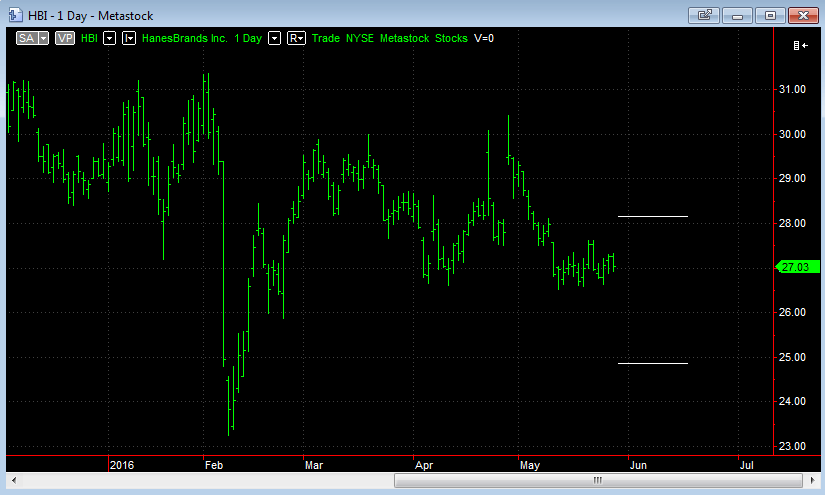
Bought 2 Strangles on HBI CYH due to volume alerts on the $27 calls and $26 puts.
ANF Long Put
| Stock | ANF |
|---|---|
| Position | Long Put |
| Trade Length | 17 Days |
| Capital | $90.00 |
| P&L | -$90.00 |
| Stock | ANF |
|---|---|
| Position | Protected Put |
| Trade Length | 7 Days |
| Capital | $3800.00 |
| P&L | $60.00 |
May 31
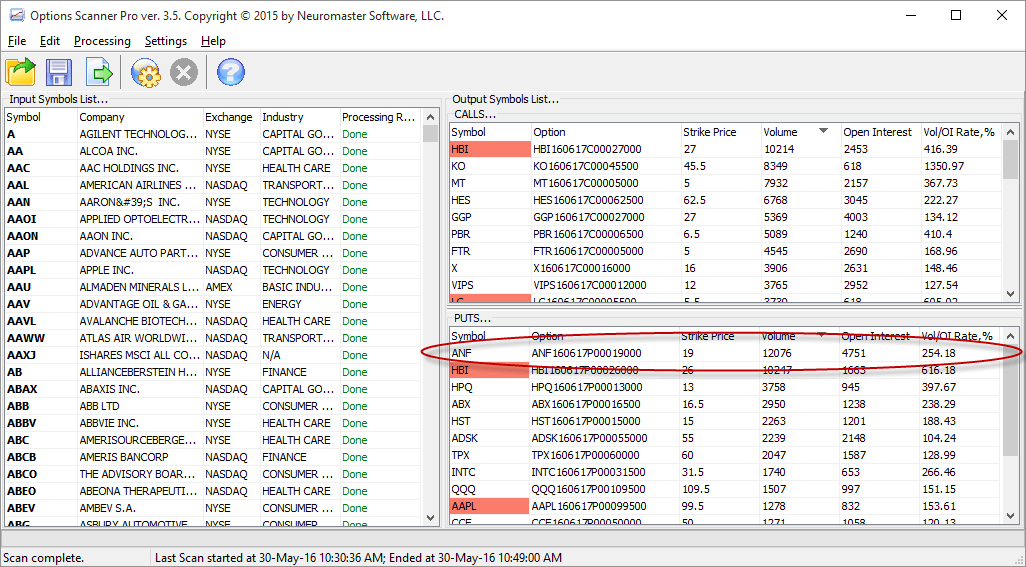
Volume spike on the June $19 put.
RF Long Call
| Stock | RF |
|---|---|
| Position | Long Call |
| Trade Length | 16 Days |
| Capital | $80.00 |
| P&L | -$80.00 |
June 1
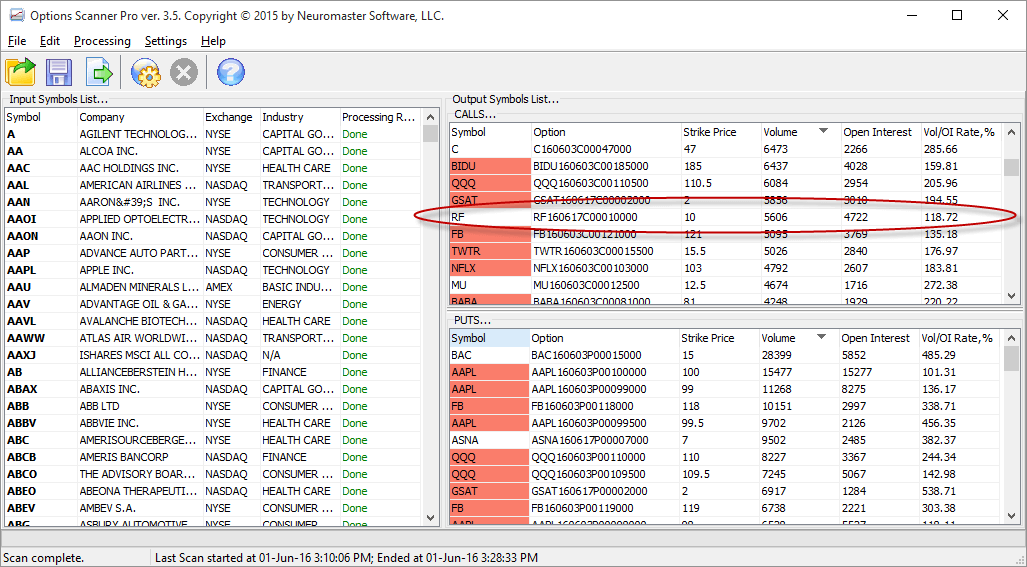
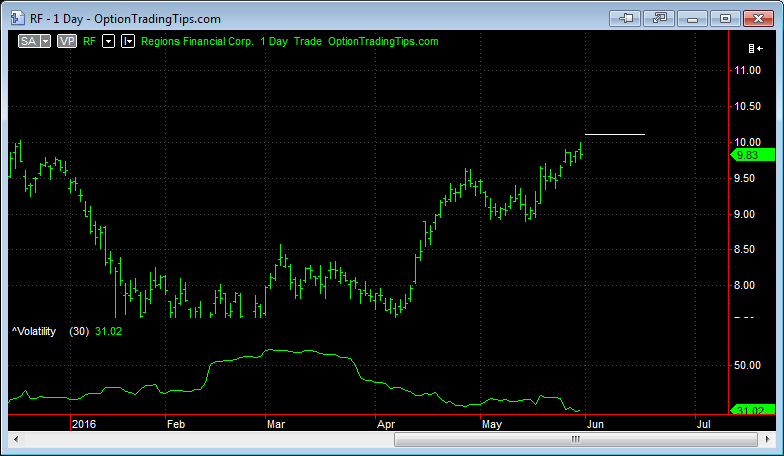
Volume spike on the June $10 Calls.


There are zero comments
Add a Comment