Put Bear Spread (EOD)
Start: February 29th, 2016
I've been trying out a new online scanner as a new way of identifying price patterns that I can consider for option setups.
EPD stock came up with a bearish setup. I checked any upcoming earning releases and nothing due until April 28th. Here is the chart as of Friday's close:
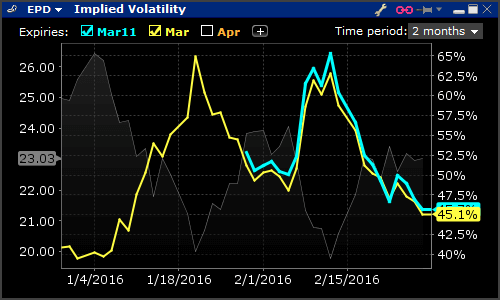
Implied volatility for both March expiries has dropped 20 percentage points from recent highs:
It is best to buy options when volatility is low and sell when volatility is high. From the above graph, it looks as though vol could have hit a low and may revert to higher levels.
Now I have two factors in my decision:
- Bearish on market price
- Bullish on volatility
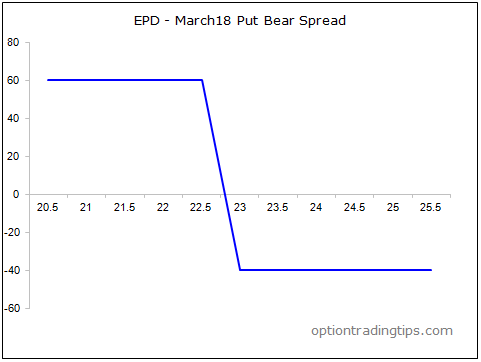
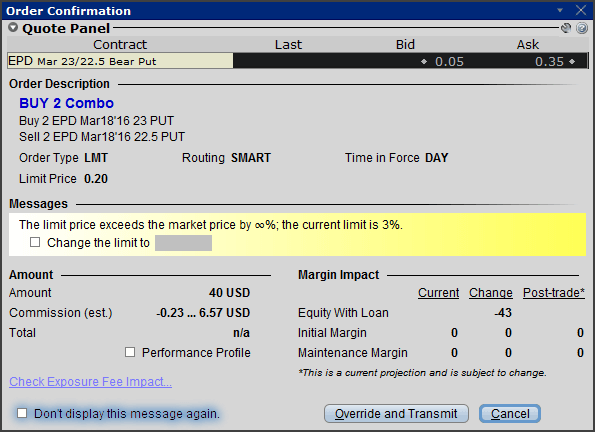
So, I need to select an option strategy that attempts to capitalize on both of these. I looked at Put Backspreads and also Iron Butterflys but I didn't really like their payoff profies. I decided on a Long Put Spread, or Put Bear Spread;


Max loss is $43 ($40 for the spread plus $2.70 in brokerage) and max gain is $60.
Small, yes, but I am still toying with small size until I build up my account before trading larger sizes.
After the market close, the spread is down -$5 so far but there is still 3 weeks to go until expiration.
Updates: March 9th
EPD up slightly by 0.13%. Implied volatility has risen slightly so the spread has made some ground to now be flat. There is one week to go...at this point, being a long spread, time decay will really hurt my position so I need the market to move fast and/or implied volatility to rise as well.
Position Closed, March 18th
EPD Closed above the long put strike level of $23 to finish the week trading at $25.50. I lose the premium paid for the spread, which was $40. The total breakdown is as follows:
| Symbol | Position | Price | Close | P&L |
|---|---|---|---|---|
| EPD Mar18 Put Bear Spread (comms $2.70) | ||||
| EPD Mar18 22.50 Put | -2 | 0.65 | 0 | 130 |
| EPD Mar18 23 Put | 2 | 0.85 | 0 | -170 |
| Total | 0.4 | 0 | -40 | |
| Grand Total | -40 |


There are zero comments
Add a Comment